
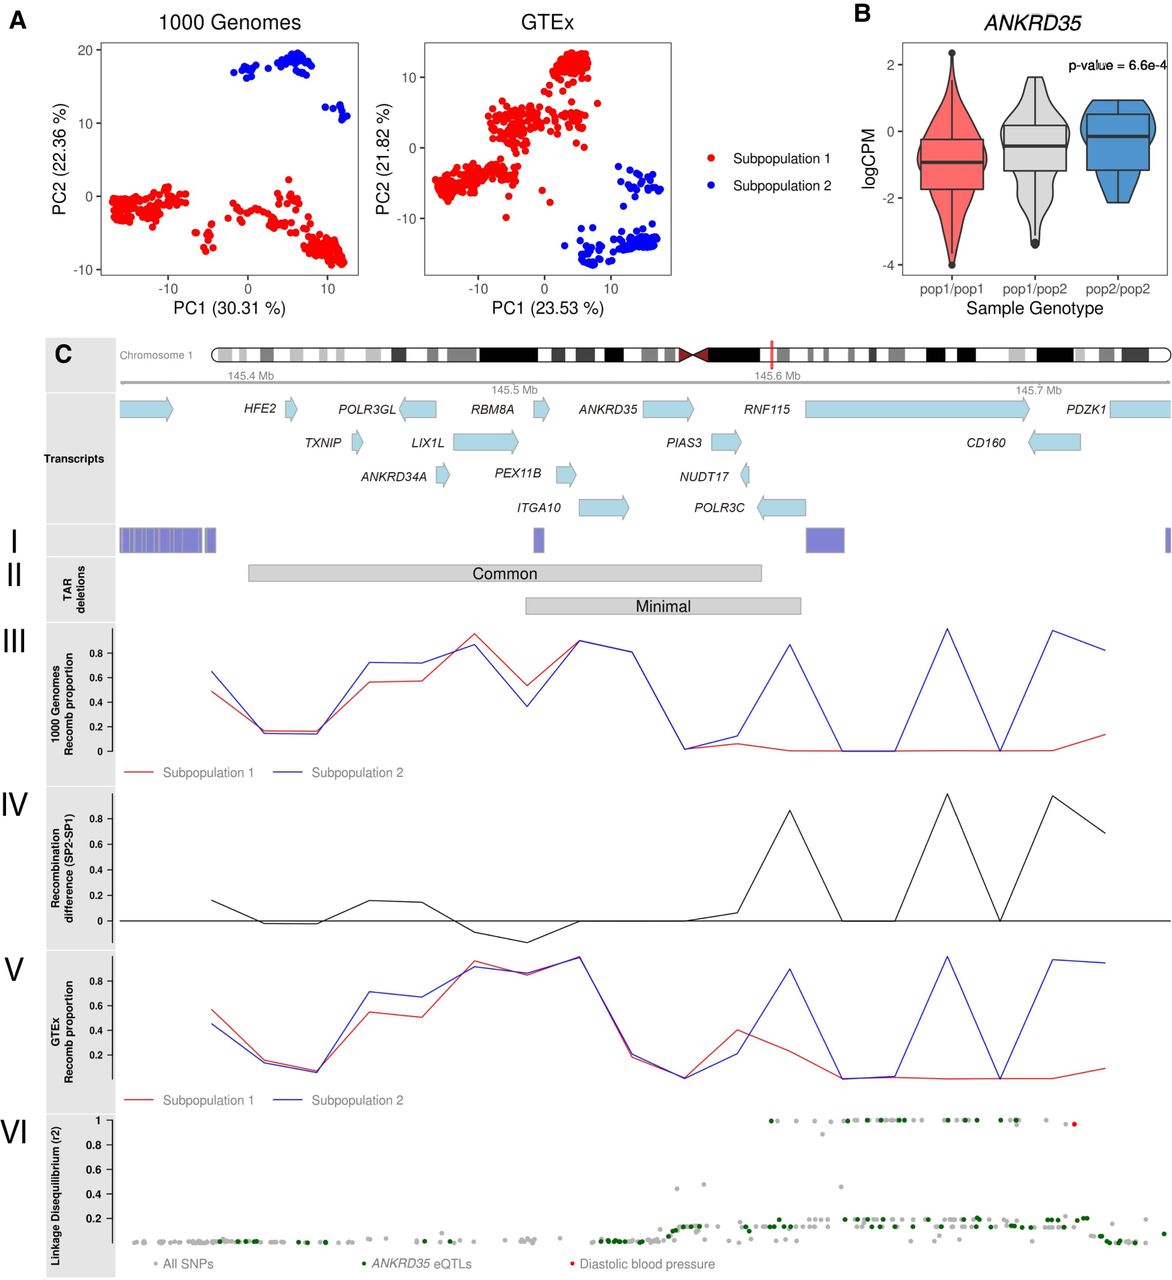
Underlying recombination patterns in the TAR syndrome locus. (A) Chromosome subpopulations with different recombination patterns between the coordinates Chr 1: 145.35–145.75 (hg19), as detected in the genomic data of The 1000 Genomes and GTEx projects. (B) Transcriptomic analyses for the genes in the region identified that ANKRD35 transcription is significantly associated with the chromosome population substructure. Individuals are grouped by their chromosome subpopulations (pop1/pop1, pop1/pop2, pop2/pop2). (C) Ideogram for the TAR region showing the genes in the region. (I) Segmental duplications. (II) Location of common and minimal deletions. (III) Proportion of recomb chromosomes in each subpopulation in the 1000 Genomes data. (IV) Difference between the proportion of recomb chromosomes in subpopulation 2 and subpopulation 1 in the 1000 Genomes data. (V) Proportion of recomb chromosomes in each subpopulation in GTEx data. (VI) Linkage disequilibrium (r2) between region SNPs and recombClust subpopulation. (Green) eQTLs for ANKRD35 in whole blood; (red) GWAS hits for diastolic blood pressure.


