
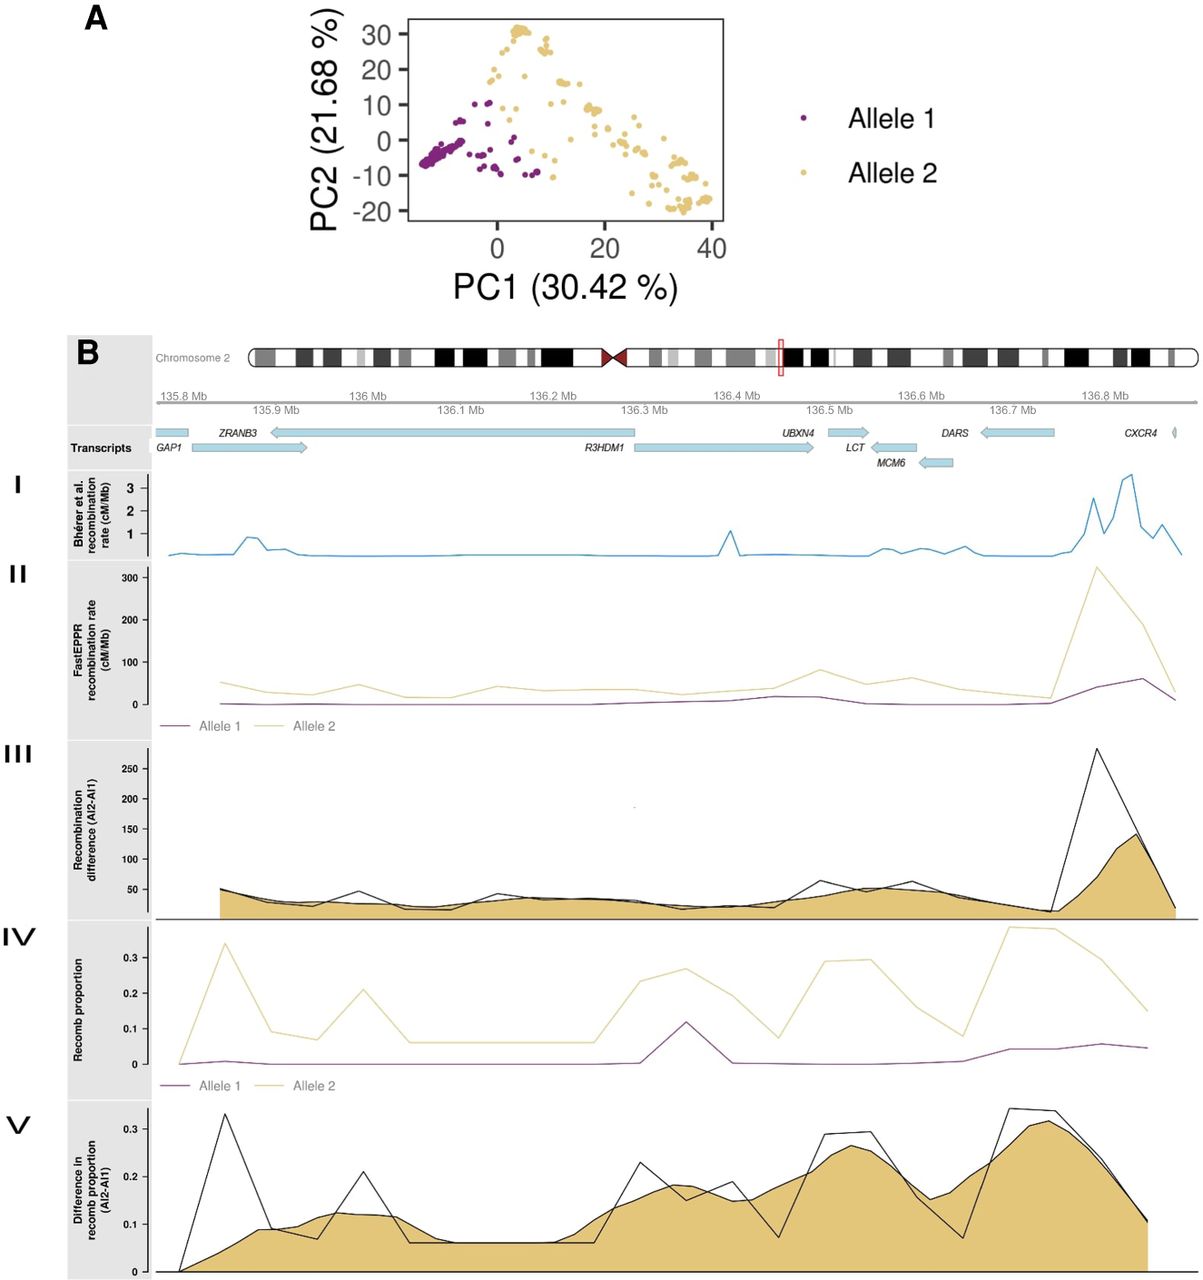
Underlying recombination patterns in the LCT locus. (A) First two principal components of chromosomes, derived from the recombination classification at multiple recombination points along the LCT locus. (B) Ideogram for the LCT locus under selection showing the genes in the region. (I) Recombination rates reported by Bhérer and colleagues (Bhérer et al. 2017). (II) Recombination rate obtained from FastEPRR independently for chromosomes with alleles 1 and 2 detected by recombClust. (III) Raw and smoothed difference (moving average) in recombination rates between alleles 1 and 2 as computed from FastEPRR. (IV) The proportion of chromosomes belonging to recomb population in the chromosome subpopulations with alleles 1 and 2, correctly predicting a flat pattern for the allele 1 that is under selection. (V) Raw and smoothed difference (moving average) in the proportion of chromosomes belonging to recomb population in alleles 1 and 2.


