
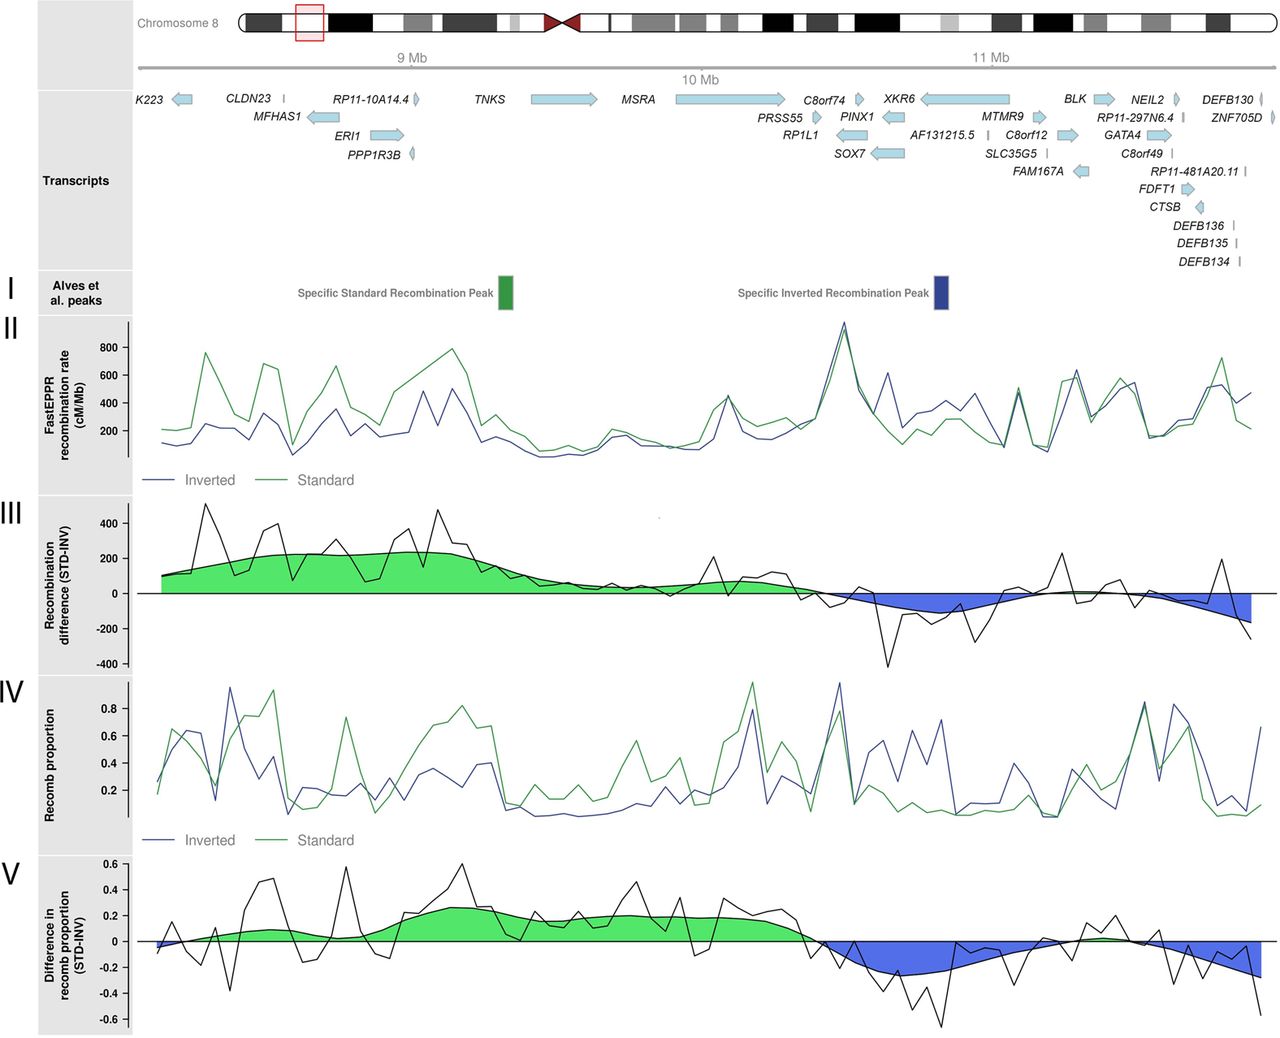
Underlying recombination patterns in human inversions 8p23.1 for the European individuals of The 1000 Genomes Project. Ideogram for the 8p23.1 inverted region showing the transcripts in the region. (I) Approximate location of recombination peaks for standard or inverted chromosomes identified by Alves and colleagues (Alves et al. 2014). (II) Recombination rate obtained from FastEPRR independently for standard and inverted chromosomes. (III) Raw and smoothed difference (moving average) in recombination rates between standard and inverted chromosomes as computed from FastEPRR. (IV) The proportion of chromosomes belonging to recomb population in the chromosome subpopulations inferred by recombClust, which accurately predicted inversion status. (V) Raw and smoothed difference (moving average) in the proportion of chromosomes belonging to the recomb population in inverted and standard chromosomes, as predicted by recombClust.


