
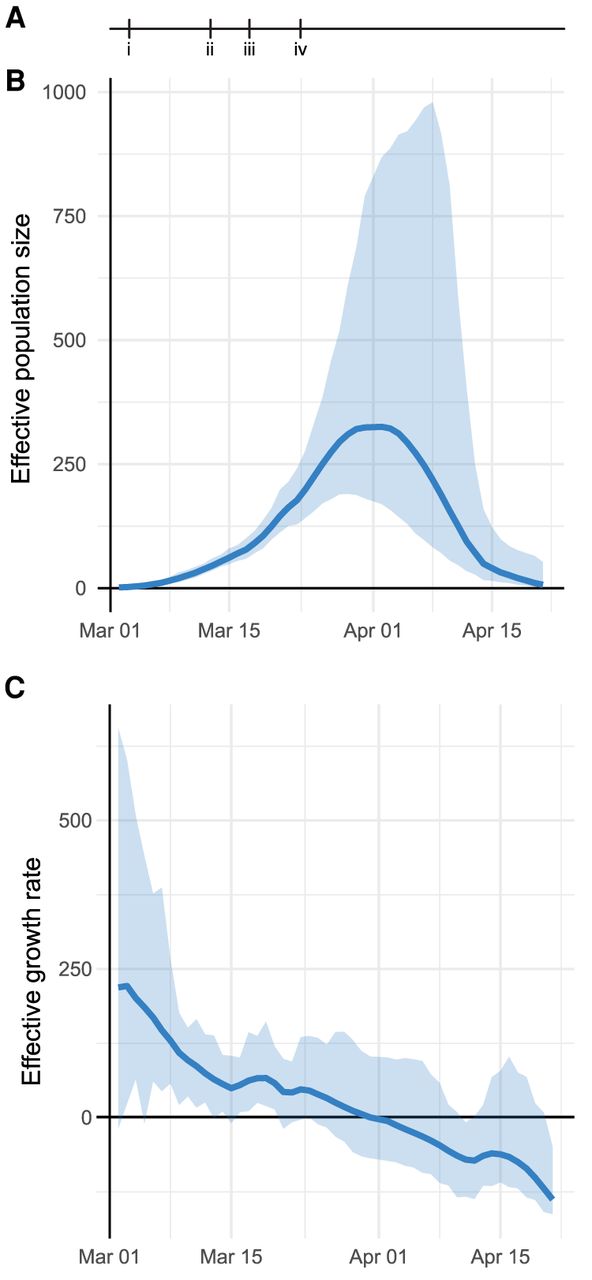
Figure 4.
Phylodynamic analysis of outbreak trajectory. (A) Timeline of New York City outbreak, highlighting (i) announcement of first community-acquired case (March 3); (ii) ban on gatherings exceeding 500 people (March 12); (iii) closure of schools, restaurants, and bars, and other venues (March 16); (iv) closure of nonessential businesses (March 22). (B,C) Outbreak trajectory estimated from genetic data showing effective population size relative to March 1 (B) and growth rate of effective population size (C; units of 1/yr). Shaded regions represent 95% credible interval.


