
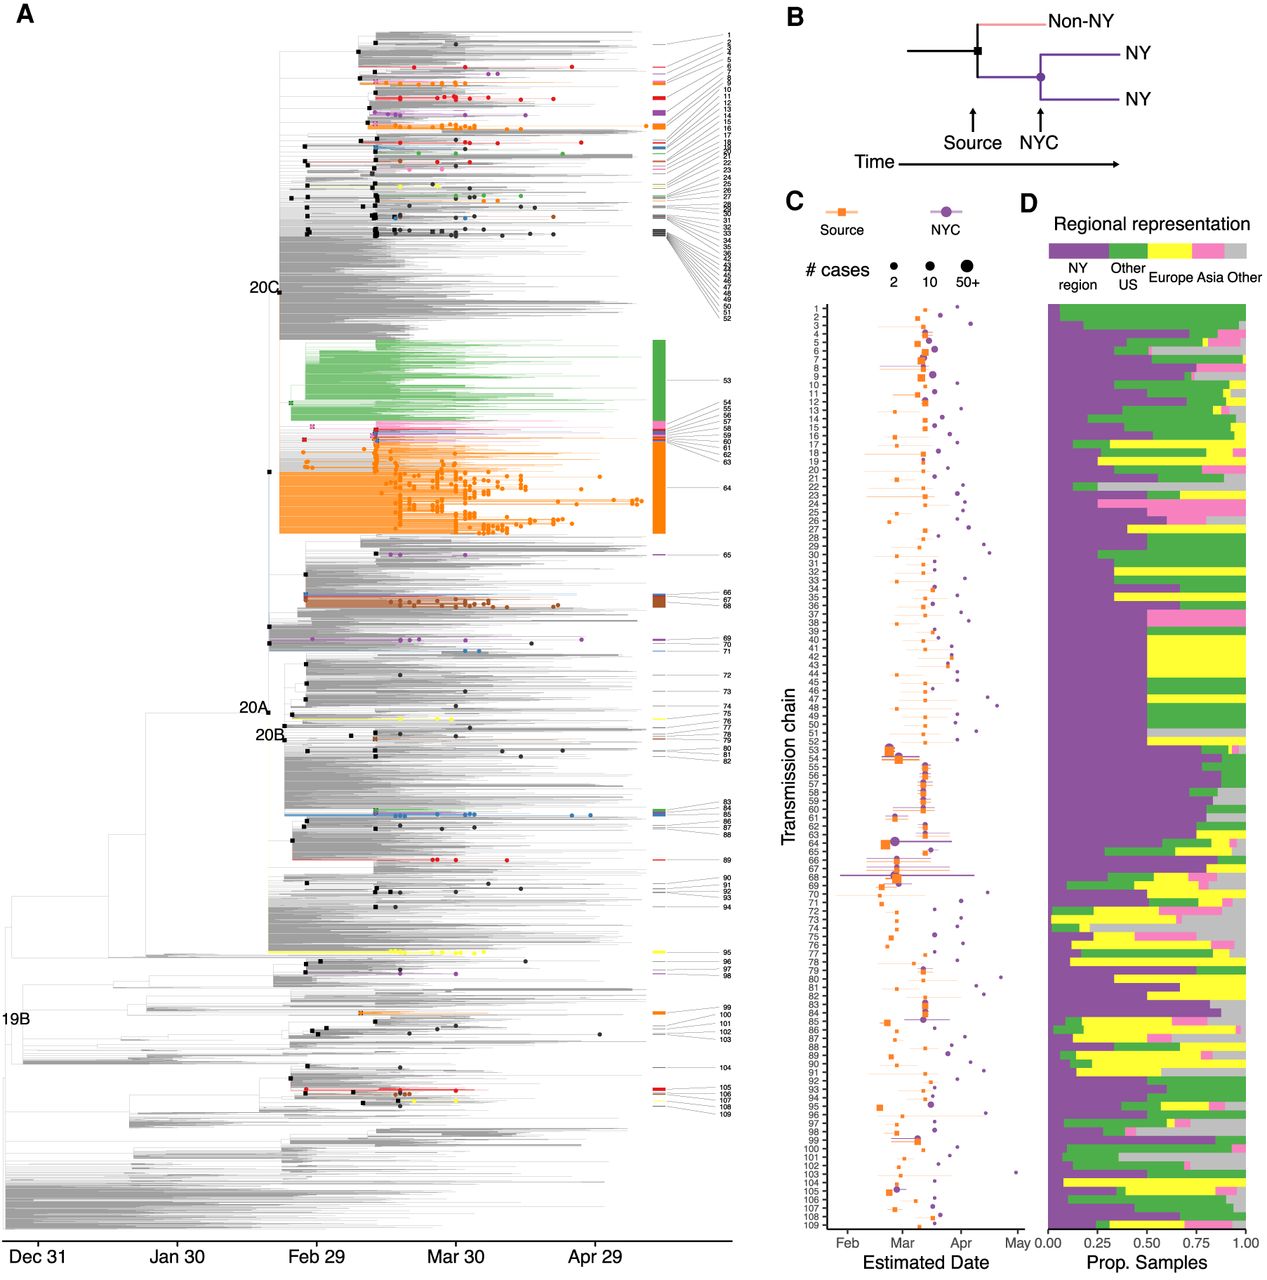
Timescaled phylogeny showing global sequence context. (A) Colored edges highlight transmission chains. Black squares indicate source nodes; dots, detected presence in the northeast United States. (B) Schematic of approach to infer introductions and transmission chains. (C,D) Transmission chains in the New York City region ordered by inferred divergence date from source. (C) Dates estimated for source transmission (orange) and earliest detected local transmission (purple) inferred from sequenced cases; lines represent 90% confidence intervals. Point size corresponds to the number of strains under source and all transmission chains. (D) Representation of global regions in each source transmission. Bar at top shows overall representation of regions in the phylogeny.


