
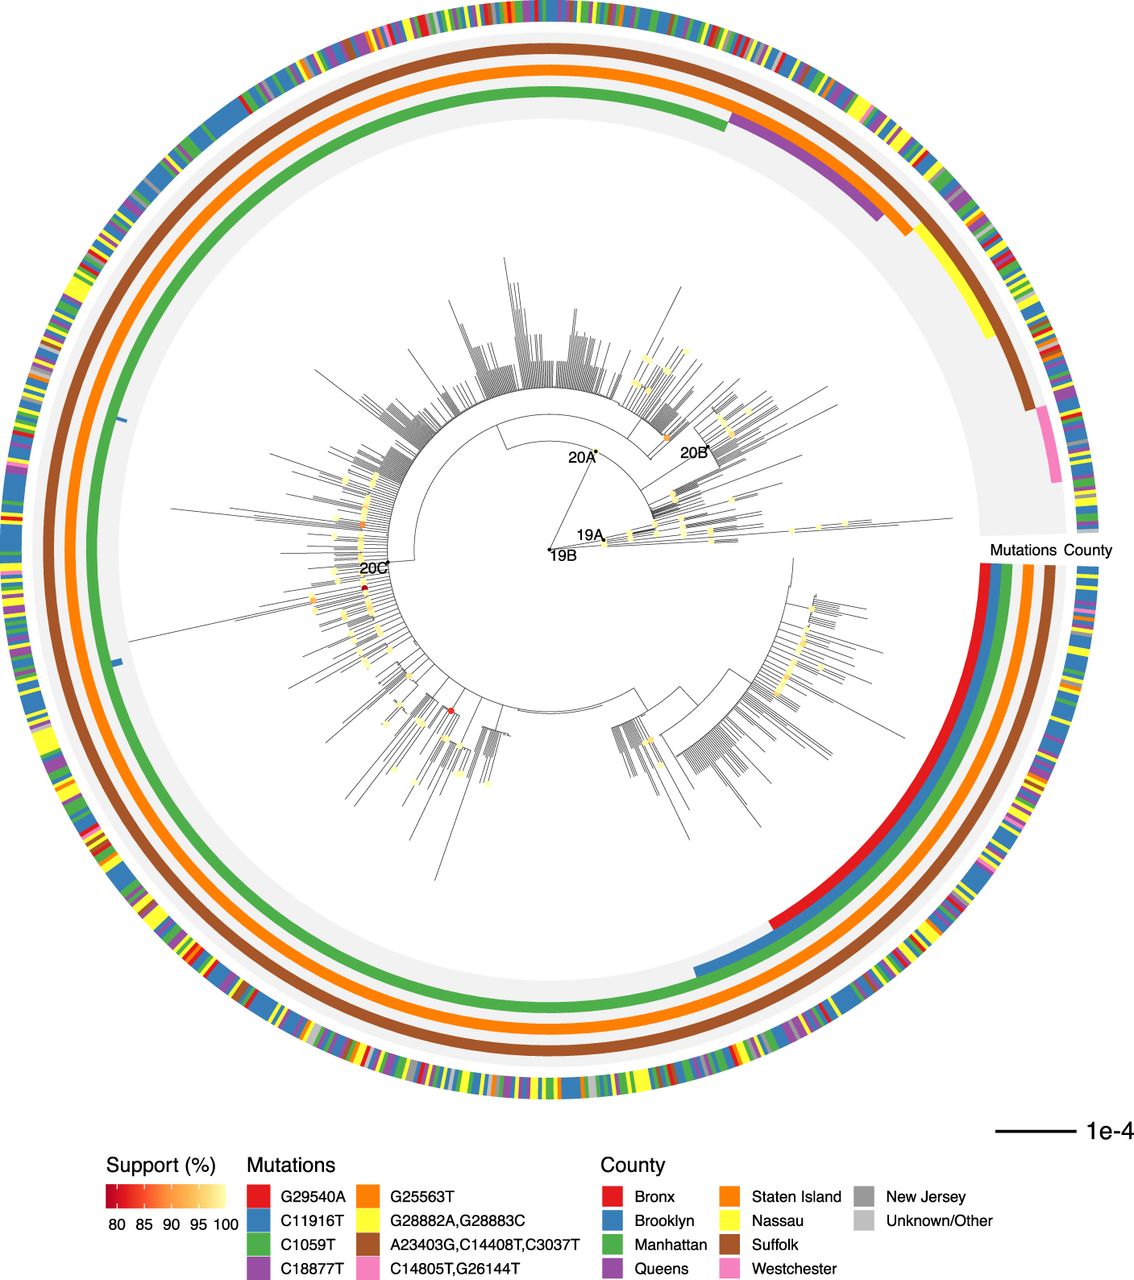
Figure 2.
Phylogenetic relationship of regional viral sequences. Maximum likelihood phylogeny inferred from 864 cases. Nodes with bootstrap support values above 75 are colored. Inner rings indicate groups of clade-defining mutations. Outer ring indicates county of residence. Scale bar, nucleotide substitutions per site.


