
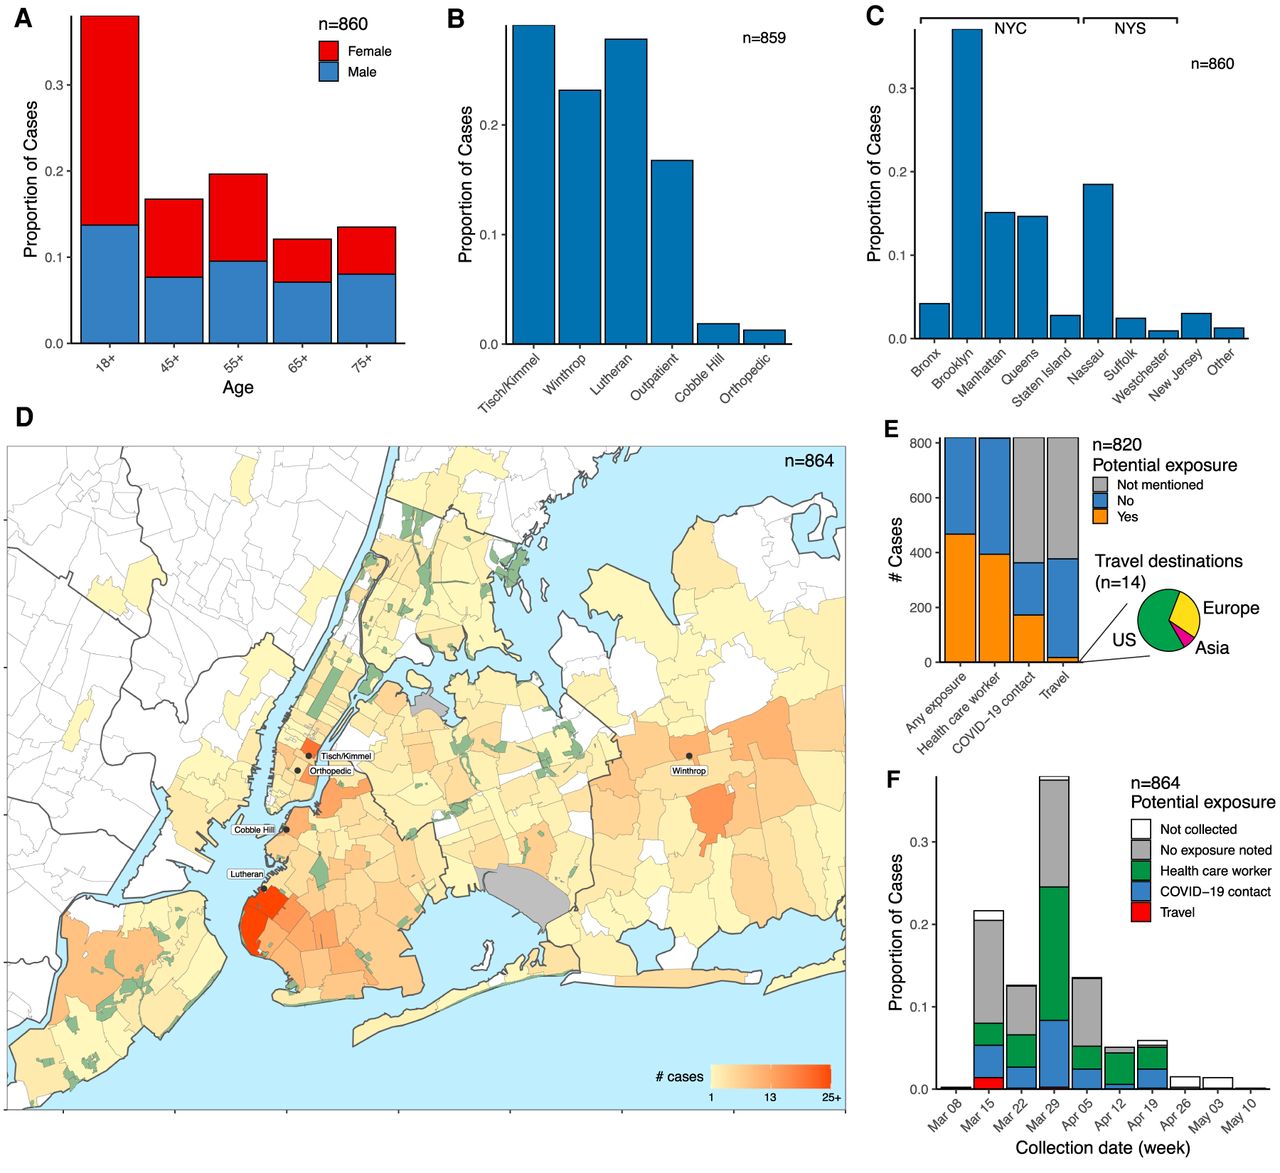
Demographic parameters of sequenced SARS-CoV-2 cases in the NYULH system. Cases are broken down as follows: (A) Age and sex; (B) collecting hospital; (C) residential location, grouped by borough and outlying counties; “Other” includes counties with few cases. (D) Localization of case residences within the New York City region. The color scale indicates number of cases per ZIP code. Collecting hospitals are labeled with rounded boxes. (E) Potential exposure status, categorized by occupation as healthcare worker, travel history, and contact with a COVID-19-positive individual. The pie chart depicts the geographical destination of the potential travel-related exposures. (F) Potential exposure status by collection date.


