
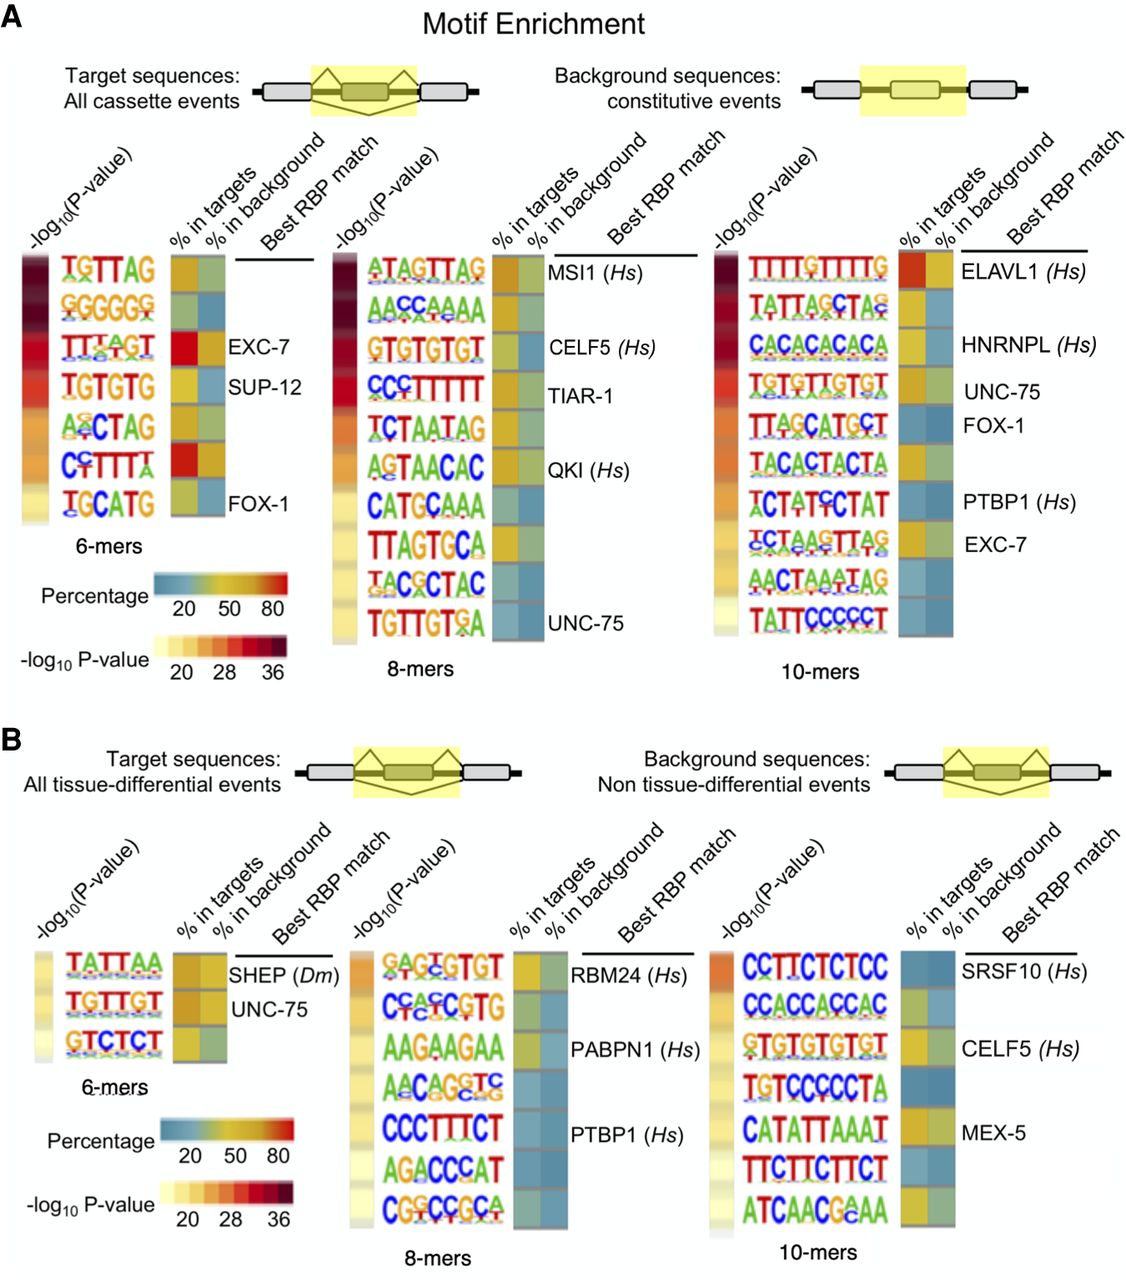
Enriched cis elements surrounding alternative exons and tissue-regulated alternative exons. (A) Enriched motifs identified when comparing all cassette-type alternative exons with constitutive exons. Top panel displays the regions compared (highlighted in yellow) spanning internal exon and flanking introns. Enrichment P-values are listed to the left of the motifs as −log10-transformed values (yellow–red scale). Motifs are presented as sequence logos derived from cis elements observed in the data. The percentage of sequences in the target group versus the background group are displayed to the right of the motif logos (blue–yellow–red scale). If a sequence motif overlaps with a known consensus motif for an RBP identified, the RBP is labeled as well as the species the consensus was derived from. (Hs) Homo sapiens. (B) Same as in A, except target sequences are tissue-regulated alternative splicing events and background sequences are non-tissue-regulated alternative splicing events. (Hs) Homo sapiens, (Dm) D. melanogaster.


