
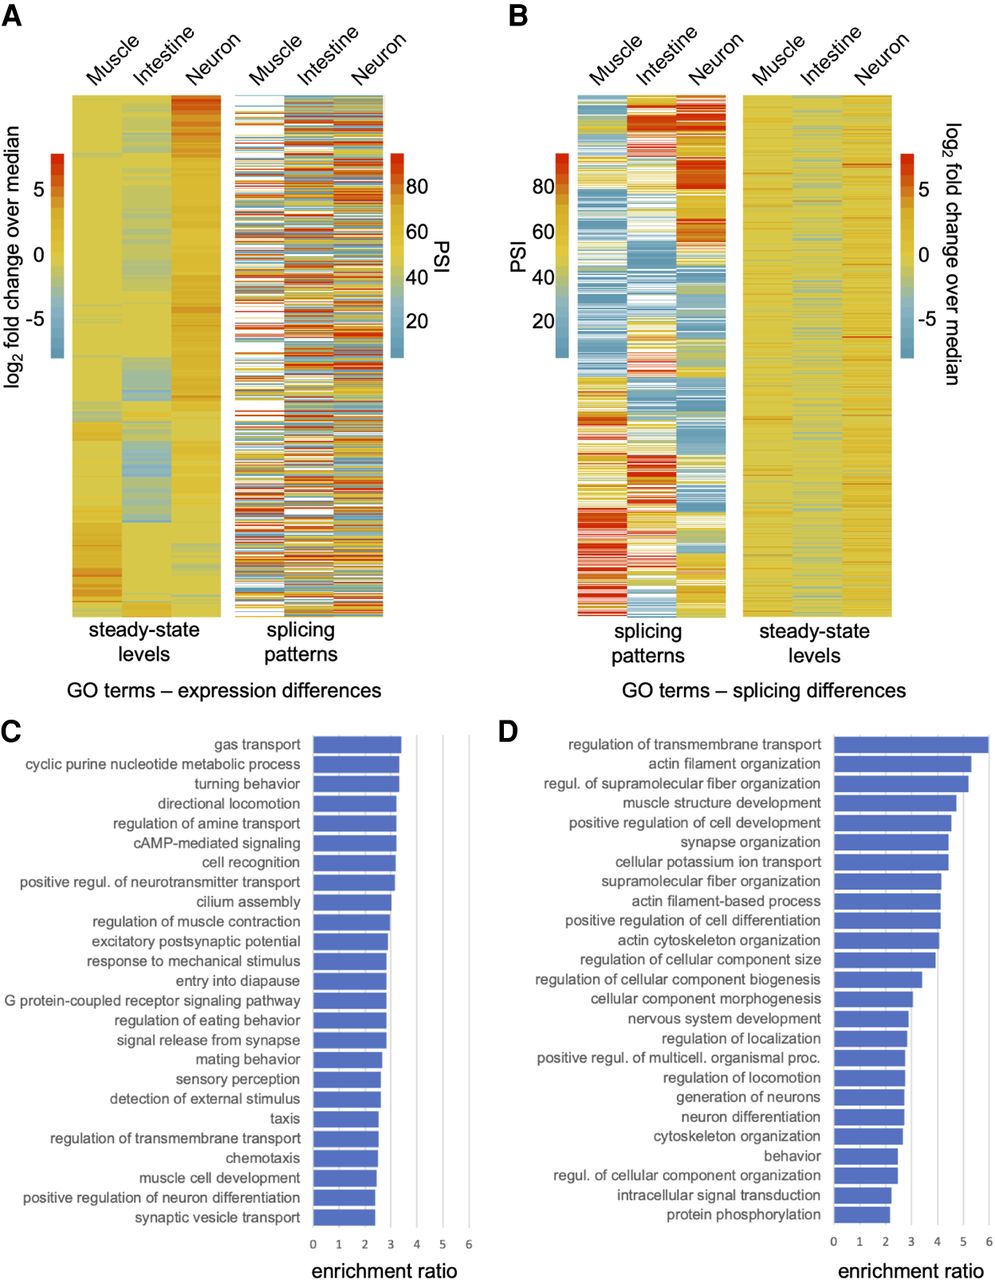
Tissue-regulated splicing and steady-state level differences are enriched in nonoverlapping gene sets. (A, left) Genes with significant steady-state transcript level differences clustered by their log2-transformed fold change over median ratios. (Right) PSI value measurements for alternative splicing events in the same genes ordered according to panel on the left. (B, left) Genes with tissue-regulated splicing patterns clustered by their respective PSI value measurements. (Right) The log2-transformed fold change over median ratios for the same genes with splicing differences, ordered according to panel on the left. (C) Gene Ontology (GO) enrichment analysis of genes with steady-state transcript level differences from heatmap in A. Overrepresentation analysis was performed applying Bonferroni correction for multiple testing. Significantly enriched biological processes with corrected P-values < 0.05 are shown. The enrichment ratio is the proportion of the number of genes in the sample set versus the number of genes in the background set for each GO category. Top 25 GO terms are listed. Full list is available in Supplemental Table S6. (D) GO enrichment analysis of genes with tissue-regulated splicing events from heatmap in B. Analysis is as described in C.


