
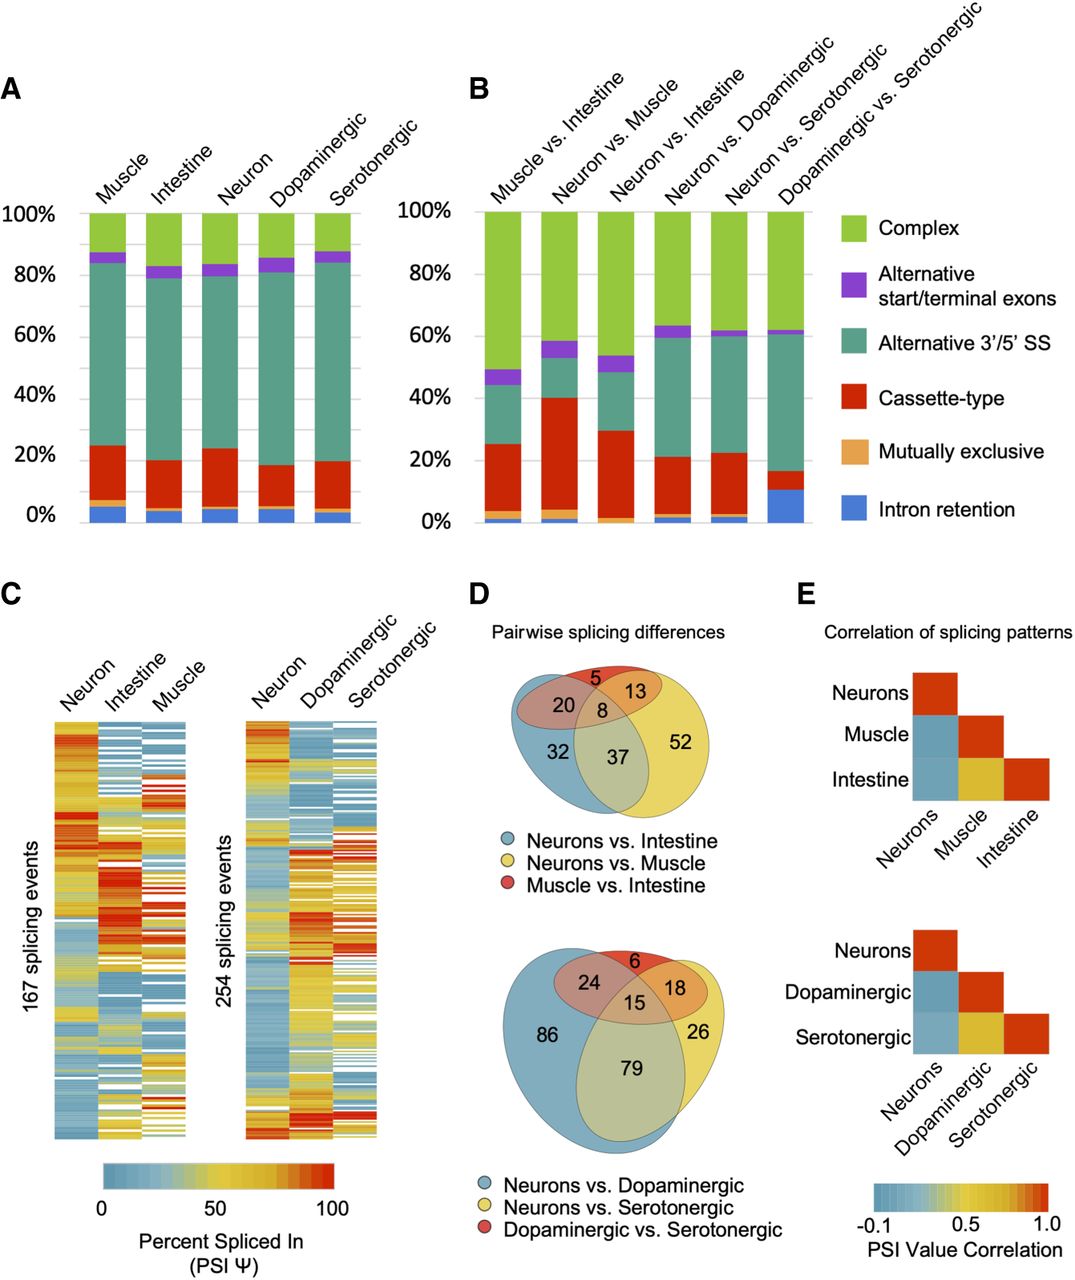
Summary and classification of tissue-regulated alternative splicing events. (A) Relative proportions of high-confidence alternative splicing events separated into five canonical splicing classes (listed in legend on the right), as well as the “complex” category comprising multiple splicing events occurring within the same gene region. Proportions in each tissue are displayed. (B) Relative proportions of alternative splicing events that show tissue-differential splicing outcomes between any two broad tissue or neuronal-subtype comparisons. Splicing events are grouped and colored by their class of splicing as in A. (C) Heatmaps displaying cassette, alternative 3′/5′ splice site, or alternative start/terminal exon splicing events that differ in PSI value by a minimum of 20%, between at least two of the three tissues/cell types. (Left) Broad tissue-specific splicing differences; (right) neuron-specific and neuro-subtype-specific splicing differences. (D) Venn diagrams representing overlap and grouping of events from heatmaps in C. Diagrams highlight splicing events that are differentially regulated between broad tissues (top diagram) or between neurons and neuronal subtypes (bottom diagram). (E) Heatmaps showing pairwise Pearson correlation values of PSI measurements for each of the broad tissue comparisons (top panel) and nervous system versus subtype comparisons (bottom panel).


