
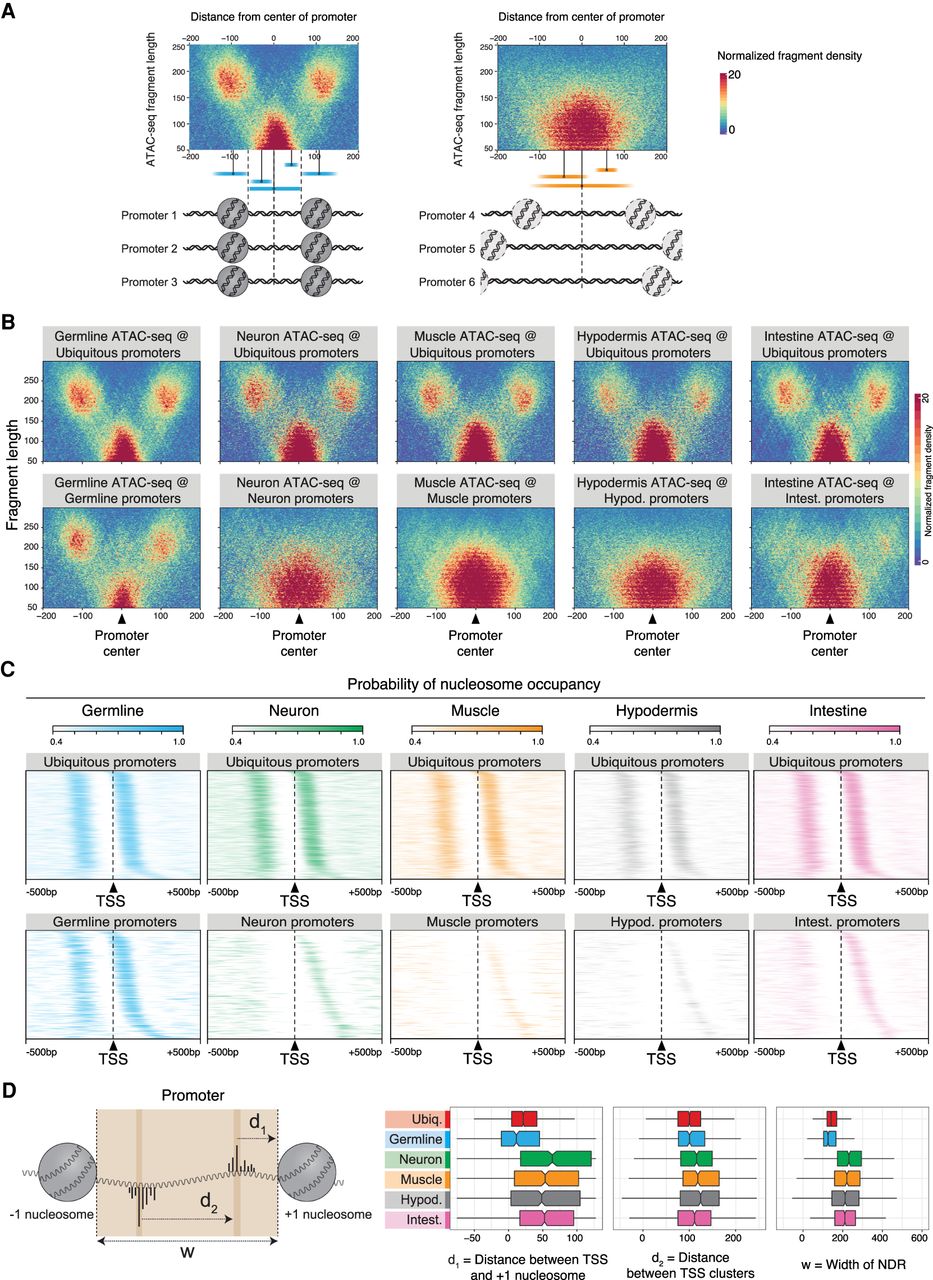
Ubiquitous and germline-specific promoters have a stereotypical architecture with well-positioned nucleosomes. (A) Interpretation of two ATAC-seq fragment density plots (also known as “V-plots”). The dense cluster of short fragments at the promoter centers represents the nucleosome-depleted region (NDR), whereas the dense clusters of longer fragments located −100 and +100 bp away from the promoter centers are indicative of aligned −1/+1 flanking nucleosomes. (B) ATAC-seq fragment density plots (V-plots) over different classes of promoters. The x-axis represents the distance between the fragment midpoint and the promoter center. The y-axis represents ATAC-seq fragment length. The color scale indicates the normalized density of ATAC-seq fragments. (C) Tissue-specific nucleosome occupancy probability over different classes of promoters aligned at their TSS. Only promoters with experimentally defined forward and reverse TSSs are considered. Rows are ordered by the distance between TSS and +1 nucleosome. (D, left) Schematic of the distance metrics measured in promoters: (d1) distance between the mode TSS and the +1 nucleosome edge; (d2) distance between modes of divergent TSSs within the same promoter; (w) width of the NDR. (Right) d1, d2, and w distance metrics for different classes of promoters. The metrics for ubiquitous promoters were measured using nucleosome occupancy probability track derived from whole young adult ATAC-seq data (Jänes et al. 2018).


