
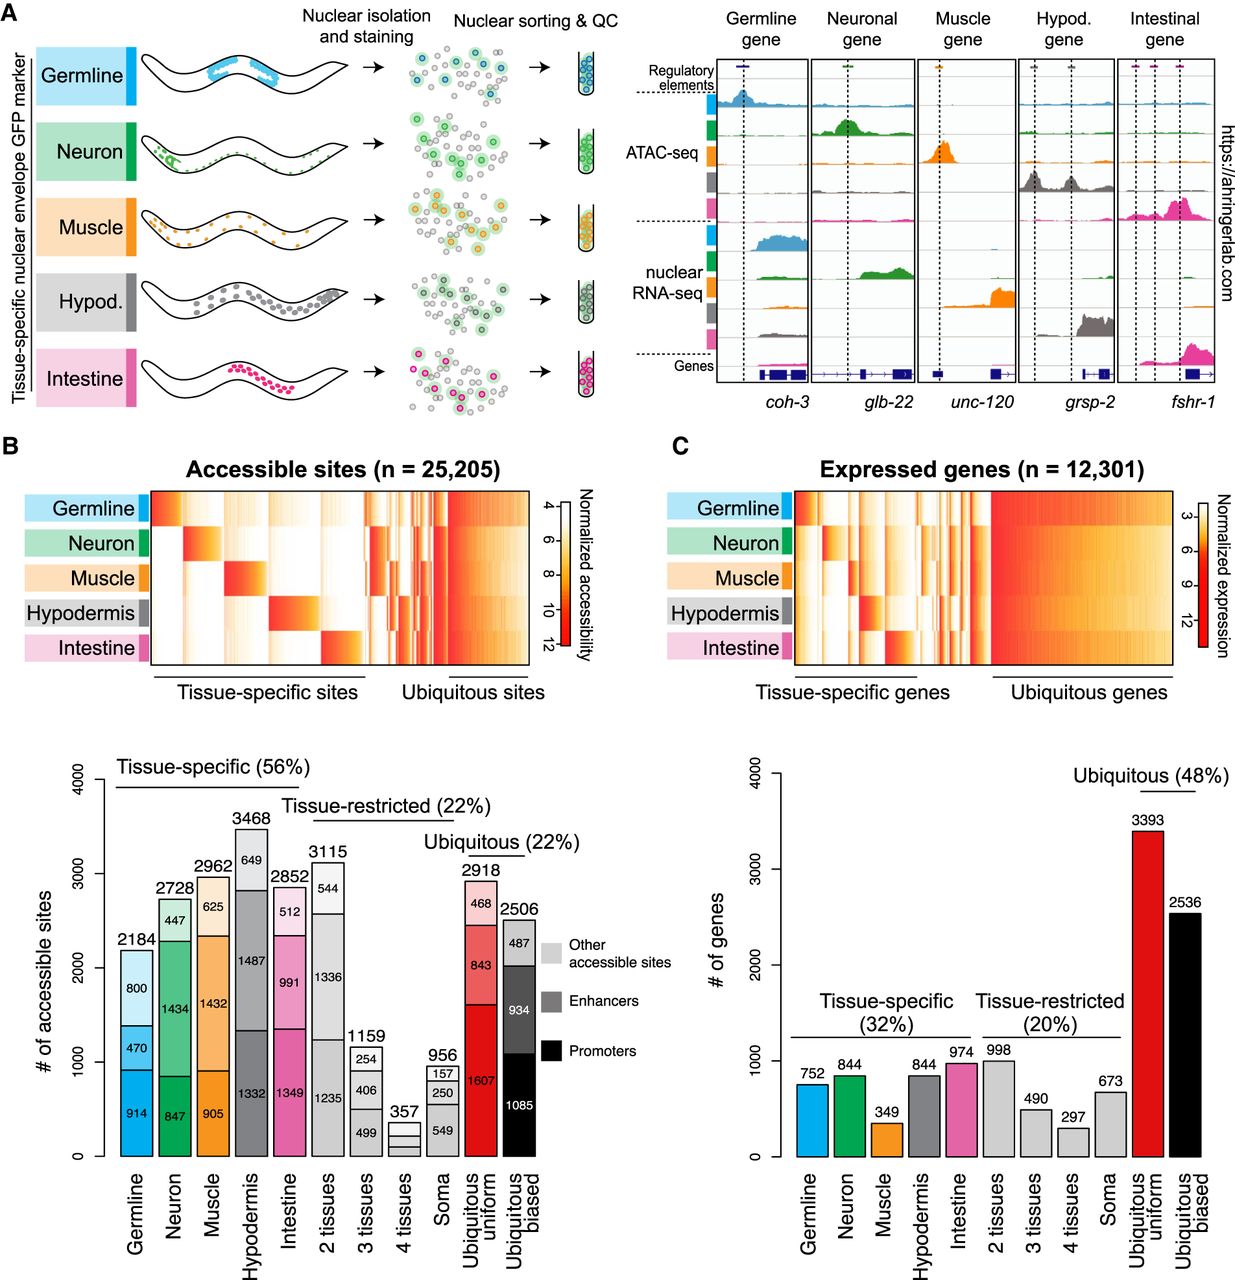
Tissue-specific profiling of chromatin accessibility and gene expression in C. elegans tissues. (A) Procedure to perform tissue-specific nuclear RNA-seq and ATAC-seq experiments. Representative results at known tissue-specific loci are shown on the right. (B, top) Heatmap of normalized accessibility (log2 RPM) for 25,205 classified sites. (Bottom) Classification of the accessible sites into tissue-specific, tissue-restricted, or ubiquitous classes. Protein-coding promoters are in dark colors, enhancers are lighter, and other accessible sites (e.g., noncoding promoters, unassigned promoters, other elements) are lightest. (C, top) Heatmap of normalized gene expression (log2 TPM) for 12,301 classified protein-coding genes. (Bottom) Classification of genes into tissue-specific, tissue-restricted, or ubiquitous classes. For classification procedure, see Methods. Unclassified sites and genes are not shown.


