
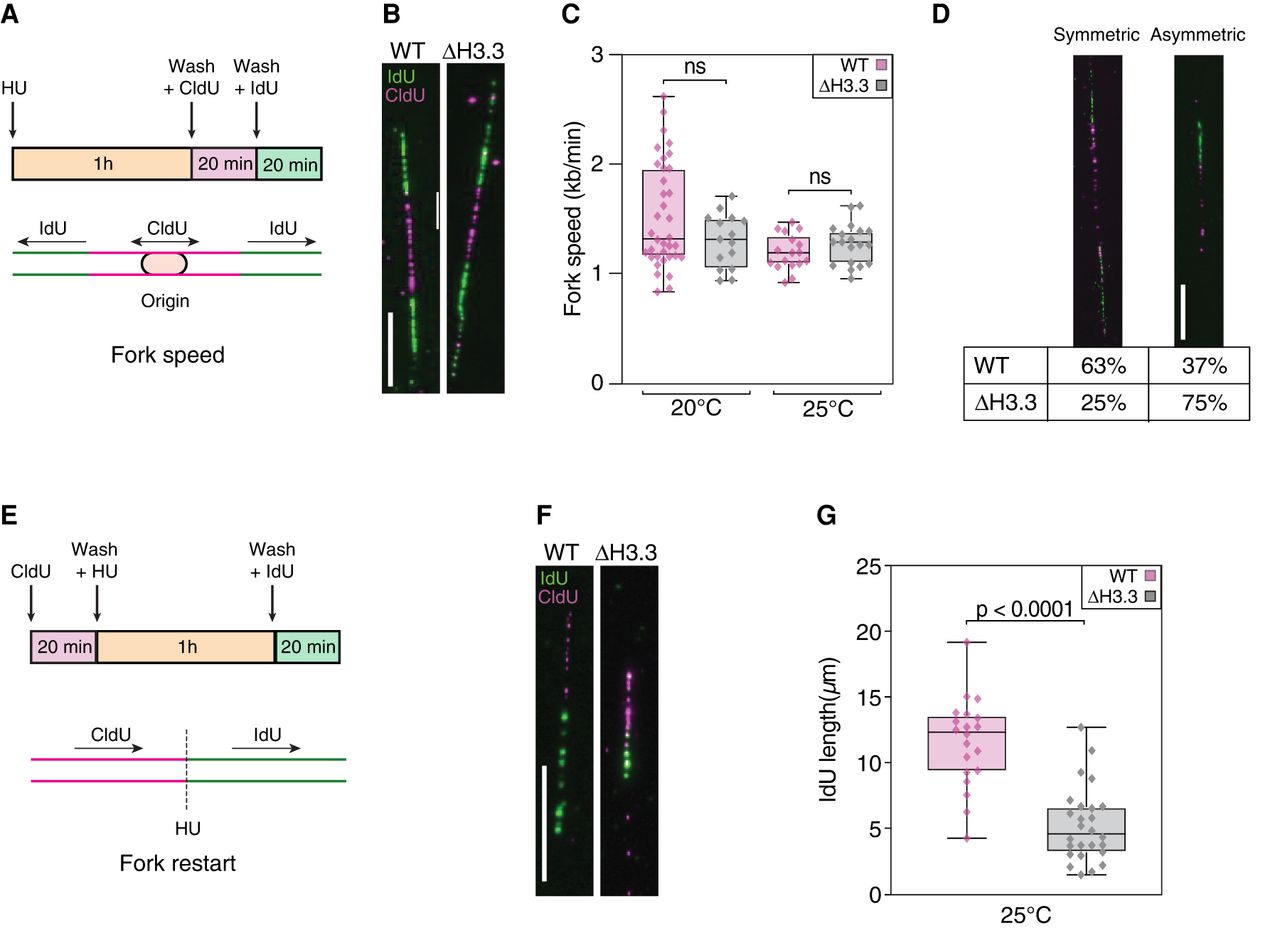
Replication fork progression or restart, but not speed, is affected by loss of H3.3. (A) Cartoon of the experimental protocol used to measure fork speed and the frequency of fork stalling. Cells were synchronized by HU during 1 h before washes and incubation with CldU for 20 min and IdU for 20 min, allowing the observation of bidirectional fork movement at origins. (B) Representative examples of DNA combing images used to measure replication fork speed for wild-type (WT) and H3.3-null mutants (Δ H3.3). (C) Fork speed determined by DNA combing at 20°C and 25°C for WT and Δ H3.3. (D) Representative examples and percentages of symmetric (left) and asymmetric (right) forks in WT and Δ H3.3 at 25°C detected by DNA combing. (E) Cartoon of the experimental protocol used to assess fork restart after HU treatment. Cells were incubated with CldU for 20 min, HU for 1 h, and IdU for 20 min, allowing detection of fork restart after fork arrest by HU treatment. (F) Representative examples of DNA combing images used to assess fork restart after HU treatment for WT and Δ H3.3 at 25°C. (G) Quantification of IdU incorporation after HU treatment for WT and Δ H3.3 at 25°C. IdU incorporation is shown in green and CldU incorporation in magenta; scale bars represent 10 µm or 20 kb in all DNA combing panels. Significance was tested using unpaired t-tests.


