
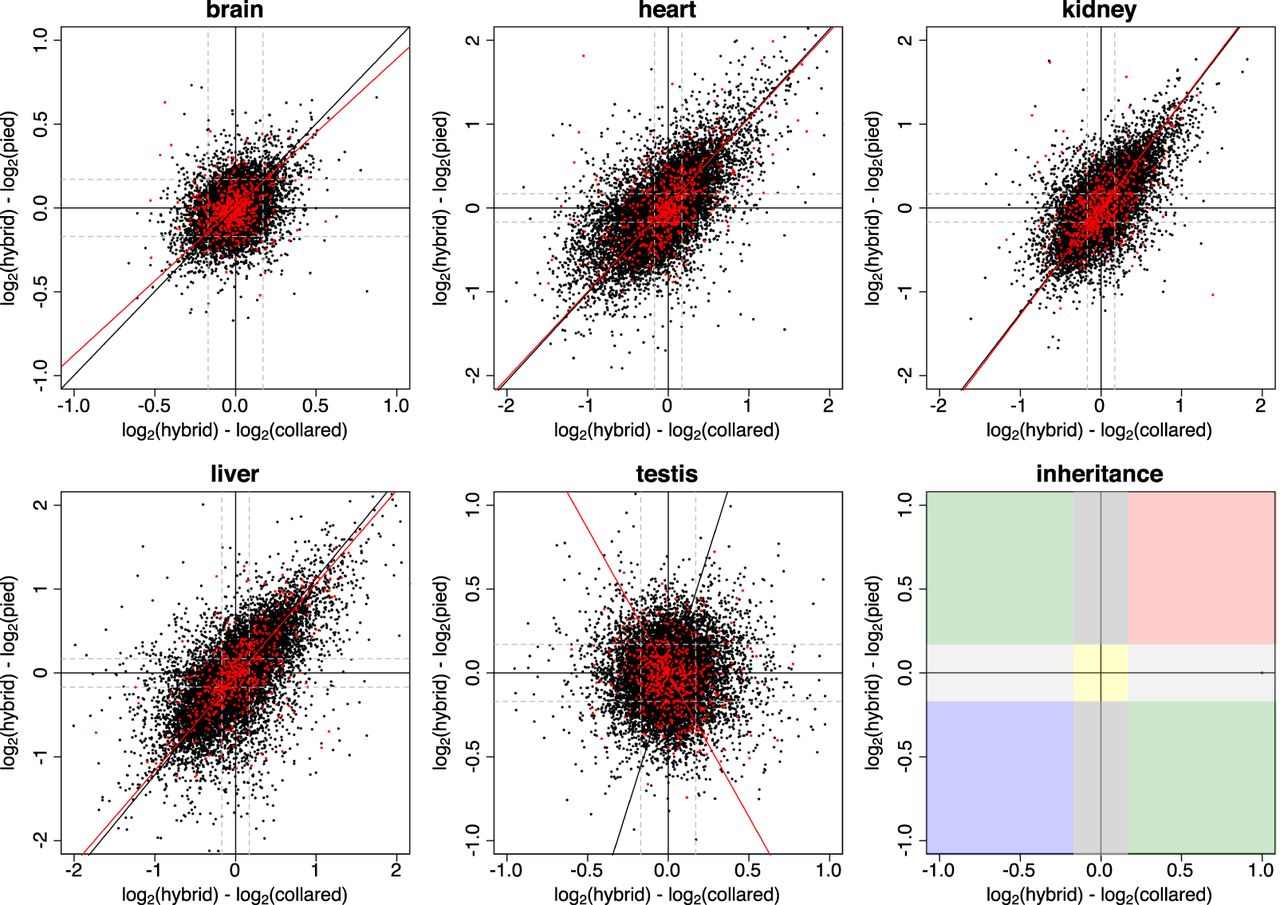
Inheritance mode of gene expression patterns in natural F1 hybrids of collared flycatcher and pied flycatcher in five tissues. The scatterplots show shrunken log2-fold changes between F1 hybrids and collared flycatcher on the x-axis, and between F1 hybrids and pied flycatcher on the y-axis. One dot represents the inheritance pattern of one gene. Autosomal genes are shown in black, genes located on the Z Chromosome are shown in red. The black and the red type II regression lines represent the major variation in log2-fold changes for autosomal and Z-linked genes, respectively. Vertical and horizontal black solid lines indicate the coordinate axes. Gray dashed lines indicate the fold-change threshold of 1.125, used for classification of inheritance patterns. Right, bottom panel: The color code illustrates the thresholds used for classification of genes, with conserved in yellow, pied-dominant inheritance in light gray, collared-dominant inheritance in dark gray, additive inheritance in green, overdominant inheritance in red, and underdominant inheritance in blue.


