
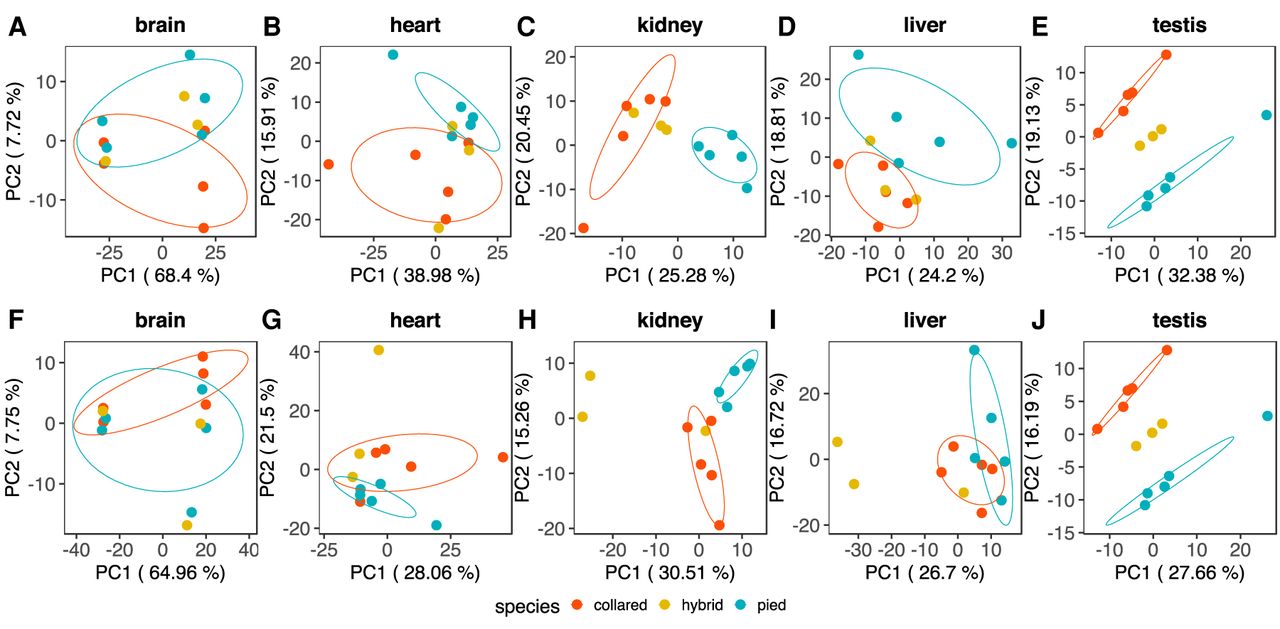
Figure 2.
Principal component analysis plots of the first two principal components of variation in gene expression in five different tissues for five collared flycatchers (red), five pied flycatchers (blue), and three F1 hybrids (yellow). Ellipses indicate the species-specific mean with a range of ±1 standard deviation, in red for collared flycatchers, in blue for pied flycatchers. Note that a sample size of three does not allow computing ellipses for the F1 hybrids. (A–E) F1 hybrids are projected onto the PCA of the parental species. (F–J) F1 hybrids are directly included in the PCA.


