
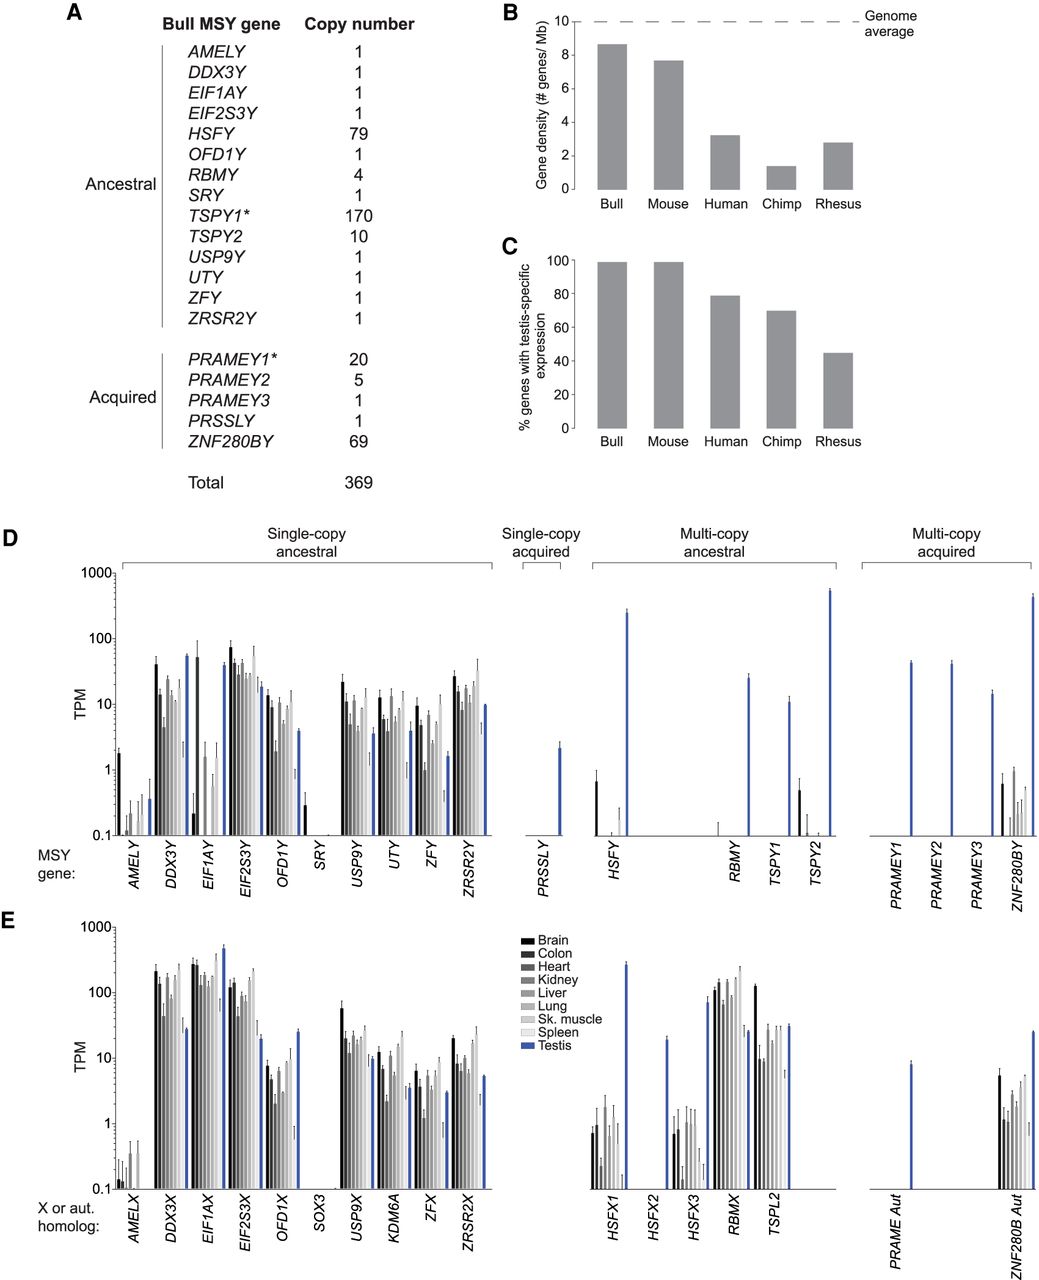
Bull MSY gene content and expression analysis. (A) Tabulation of ancestral and acquired protein-coding genes in bull MSY. Only intact genes, not pseudogenes, are counted in these totals. We confirmed transcription of all single-copy genes and representative members of multicopy gene families. Copy numbers for TSPY1 and PRAMEY1 are estimates because these gene families are located within tandem arrays, for which we have only partial sequence. Copy numbers were calculated by determining BAC coverage within each array, which gives an estimate of its total size. (B) Plot of protein-coding gene density (number of protein-coding genes per Mb) in the five sequenced MSYs: bull, mouse, human, chimpanzee, and rhesus. (C) Plot of percentage of MSY protein-coding genes with testis-specific expression in the five sequenced MSYs. (D,E) Gene expression analysis includes RNA-seq data sets previously generated from nine adult male Bos taurus (Holstein) tissues. Expression levels for MSY genes (D) and their X or autosome homologs (E) were estimated in transcript per million (TPM) units. TPM values are plotted on a log10 scale. Three biological replicates were analyzed for each tissue; means with standard errors are plotted.


