
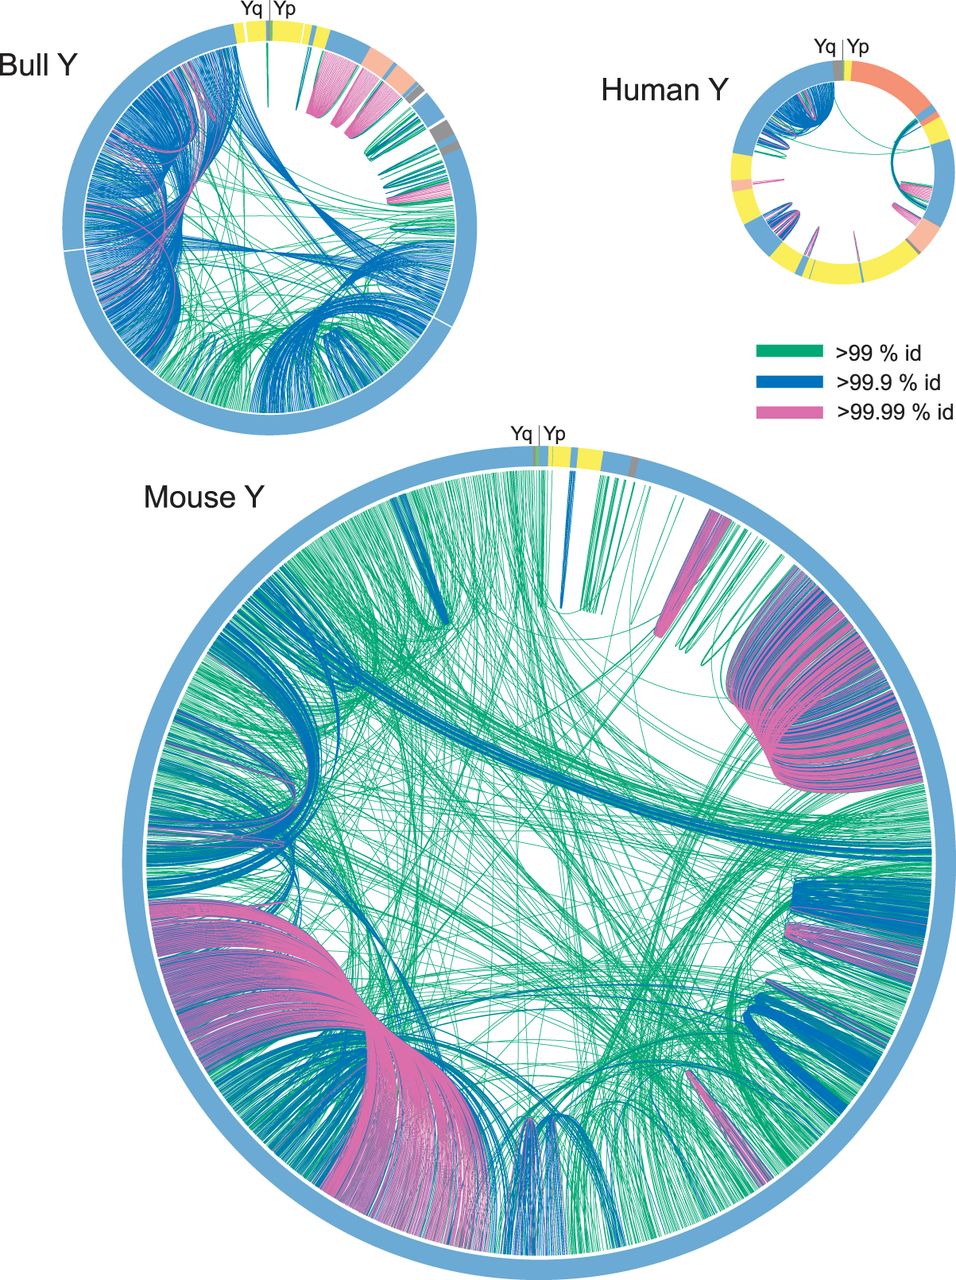
Intrachromosomal similarities in bull, human, and mouse MSYs. Circos plots were generated to visualize intrachromosomal DNA similarities at three different percent identity cutoffs. Bull, mouse, and human MSYs are represented, to scale, as circle diagrams; black tick mark at top of circle denotes the artificial junction between the Yp and Yq termini; color-coding corresponds to sequence class as in Figure 1. For each MSY sequence, stepwise 50-kb segments were compared to the remaining unmasked sequence within the MSY. Lines within plots connect each 50-kb query to its top hit (only hits >10 kb in length are plotted). Line colors indicate minimum percent nucleotide identity of hits as shown.


