
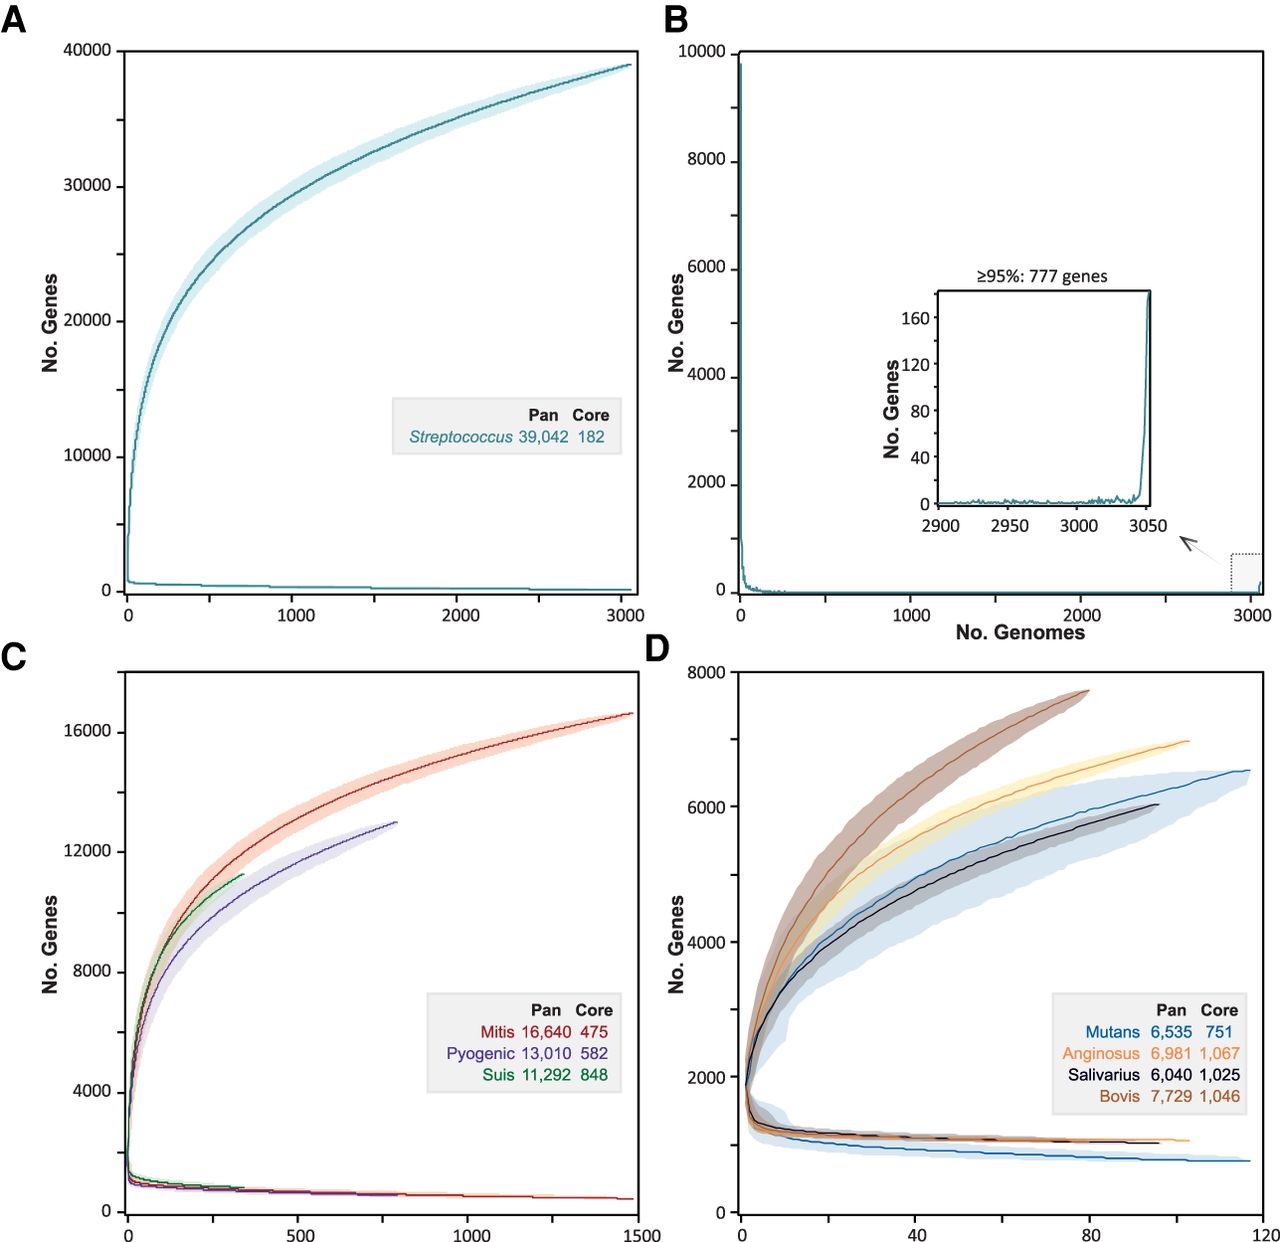
Rarefaction curves of pangenomic and core gene numbers in Streptococcus and its seven major taxonomic subgroups. (A) Rarefaction curves created with PEPPAN_parser for the accumulations of pan genes and core genes of 3052 Streptococcus representative genomes from 1000 random permutations. (B) The frequencies of pan genes (y-axis) by the numbers of genomes that carried that many genes (x-axis). The inset shows the relaxed core genes present in ≥95% of the genomes. (C) Rarefaction curves of genomes in the Mitis, Pyogenic, and Suis groups. (D) Rarefaction curves of genomes in the Mutans, Anginosus, Salivarius, and Bovis groups. The dark lines in A, C, and D indicate median values and the shadows indicate 95% confidence intervals.


