
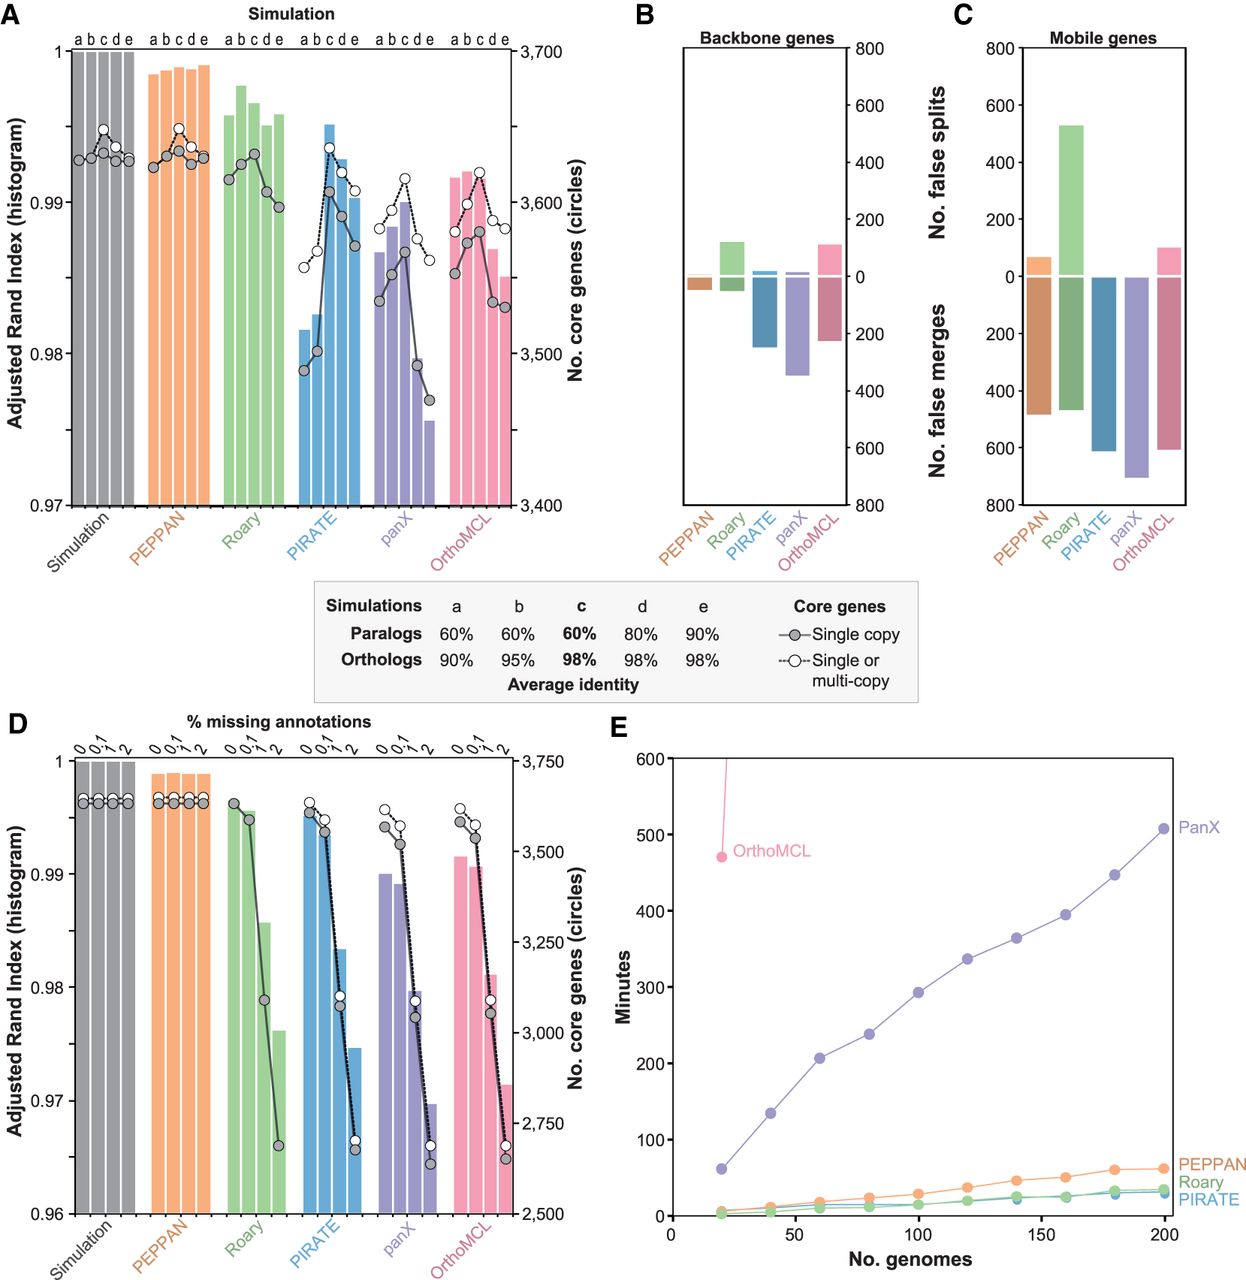
Comparison of the pangenome pipelines with simulated data generated by SimPan. (A) The adjusted Rand index (ARI; histogram) and the sizes of core genomes (circles) in the pangenomes produced by SimPan simulations a, b, c, d, e (inset). (Left) Pangenome produced by the simulations. Other histograms, pangenomes calculated by five pipelines. (B) Numbers of failed splits (top) and false merges (bottom) of ortholog groups by five pipelines with backbone genes. (C) Numbers of failed splits (top) and false merges (bottom) of ortholog groups by five pipelines with mobile genes. (D) The adjusted Rand index (ARI; histogram) and the sizes of core genomes (circles) in the pangenomes produced by SimPan simulation c after random deletions of 0%, 0.1%, 1%, and 2% of the gene annotations. Other details as in A. (E) Runtime for each pipeline (y-axis) versus number of genomes in simulated data sets (x-axis). Runs that exceed 600 min are not shown.


