
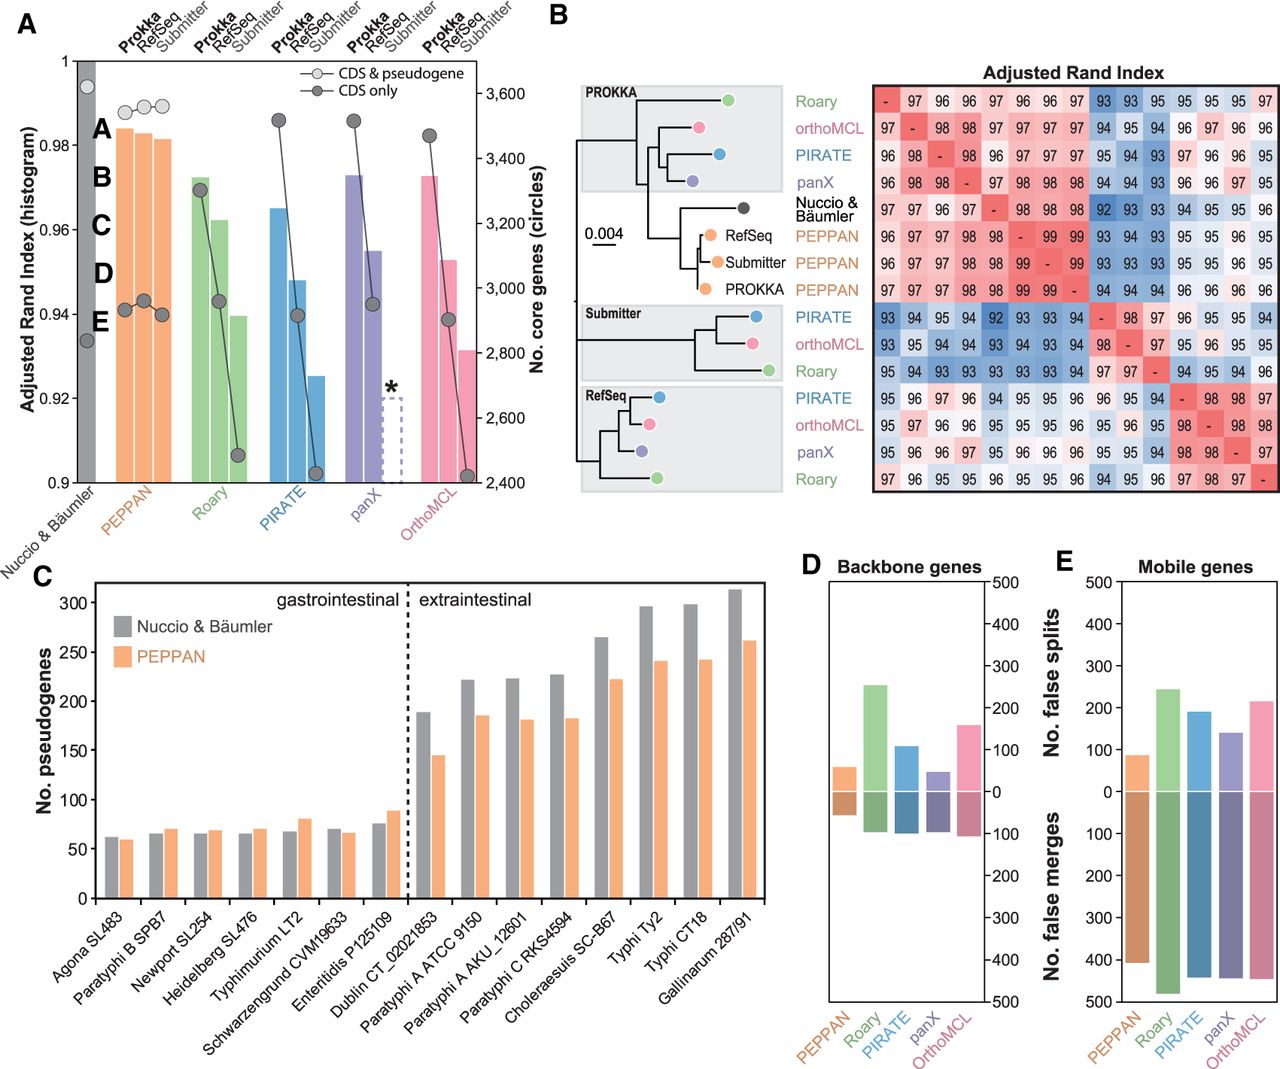
Comparison of pangenome predictions for 15 Salmonella genomes with a manually curated pangenome (Nuccio and Bäumler 2014). (A) The adjusted Rand index versus the manual curation (ARI; histogram) and the sizes of core genomes (circles) in each of the pangenomes after annotation by PROKKA (Seemann 2014), after reannotation in RefSeq with PGAP (Tatusova et al. 2016), and as originally submitted to NCBI (Submitter). An asterisk indicates that panX failed to run on the “Submitter” annotations. (B) A neighbor-joining tree (left) of the pairwise ARI scores (heatmap at the right) between the predicted pangenomes and the curated pangenome. The annotation source is indicated within gray shadows at the left except for PEPPAN, where it is listed at the tips. Colors are as in A. (C) Histogram of the numbers of pseudogenes (y-axis) in each of the genomes (x-axis) in the curated pangenome (gray) and pangenome predicted by PEPPAN (orange). A dashed line separates the two Salmonella pathovar groups described by Nuccio and Bäumler. (D,E) Histograms of the average numbers of false splits (top) and merges (bottom) of ortholog groups by the individual pipelines (x-axis) in backbone (D) or mobile (E) genes.


