
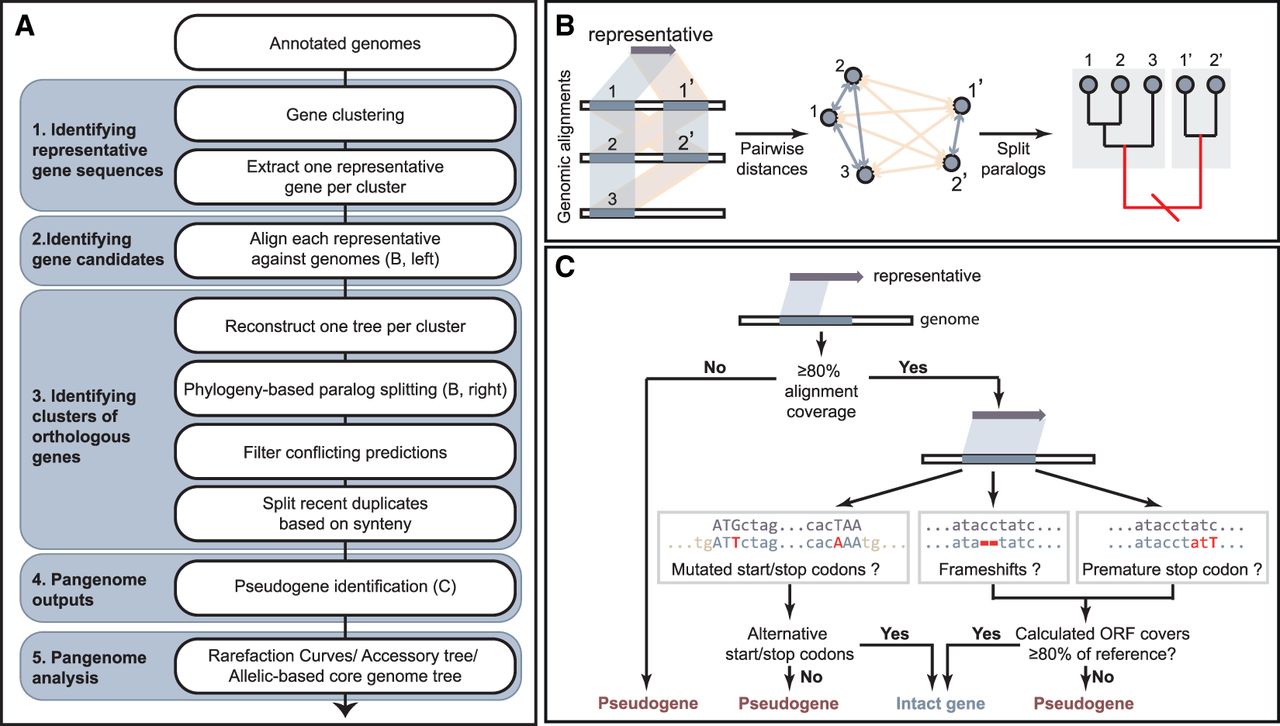
A brief overview of the workflow for PEPPAN. (A) Flow chart indicating the five cascading groups of operations (blue-gray) from top to bottom. (B) Cartoon of similarity-based prediction of gene candidates (left) and phylogeny-based paralog splitting (middle and right). The tree was split at the red branch (right) to separate gene candidates into two subclusters. The gene pairs in the same subcluster had low paralogous scores (blue-gray quadrilaterals [left] and arrows [middle]), whereas gene pairs between the subclusters had high paralogous scores (yellow). (C) Flow chart of the pseudogene identification. The detailed workflow of the algorithm implemented in PEPPAN can be found in Supplemental Fig. S1 and Supplemental Text 1.


