
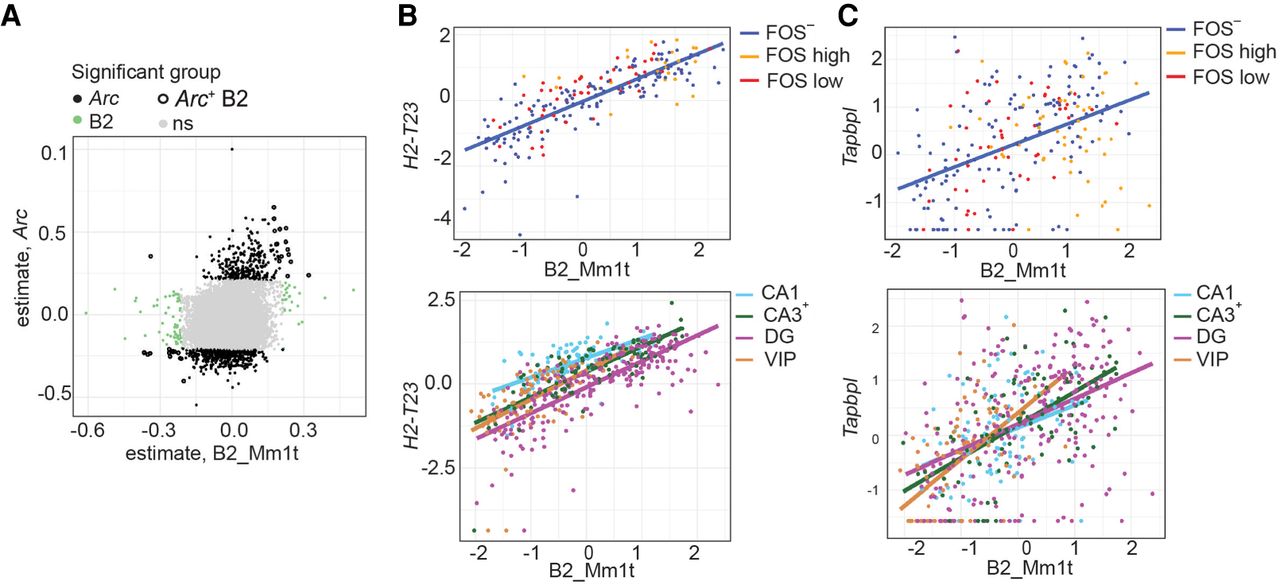
Figure 6.
B2 element expression is associated with stress-response genes. (A) Correlation plot of the association of B2_Mm1t expression and a given gene versus the association of Arc expression and a given gene. Each dot represents a gene. (B,C) Association of B2_Mm1t expression with H2-T23 (B) and Tapbpl (C) in inactive and activated DG neurons (top) or inactivated and activated neurons from all extracted hippocampal cell types (bottom).


