
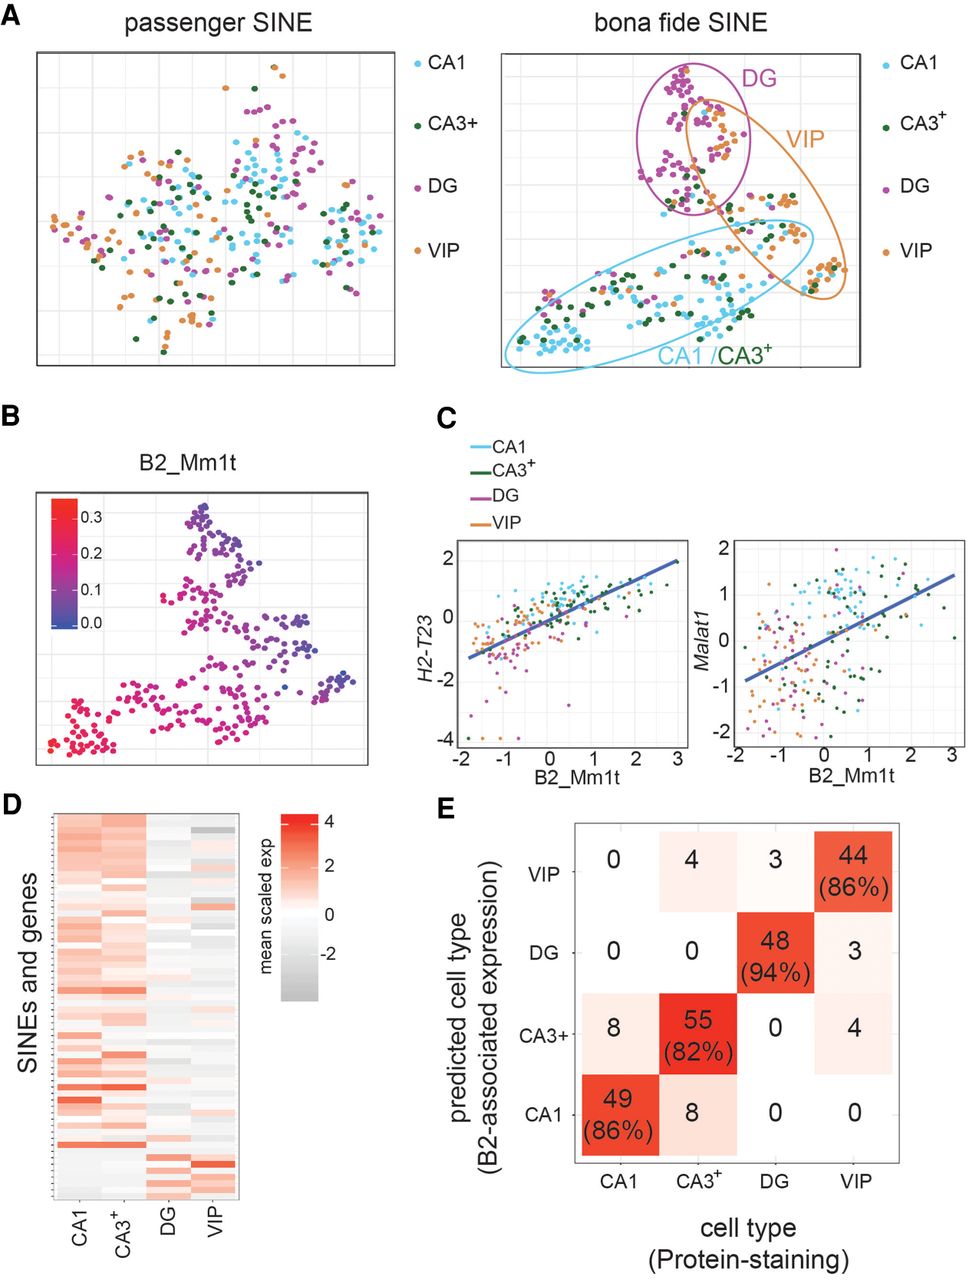
Cell type–specific expression of SINEs (A) t-SNE plot using passenger SINEs (left) or bona fide SINEs (right). Each dot represents a single nucleus colored by the staining pattern: PROX1−CTIP2+ = CA1, PROX1−CTIP2− CA3+, PROX1+CTIP2+ = DG, PROX1+CTIP2− = VIP. (B) The same bona fide SINE t-SNE plot as in A, right, colored by B2-Mm1t expression. (C) Correlation between top B2-Mm1t–associated genes with B2-Mm1t expression in FOS− hippocampal neurons. (D) Heatmap of the average expression of all genes associated with B2_Mm1t as a function of cell type. (E) Confusion matrix from random forest model trained only on B2-associated SINEs transcripts to predict cell type–associated protein staining. Numbers indicate the number of nuclei predicted as the corresponding cell type.


