
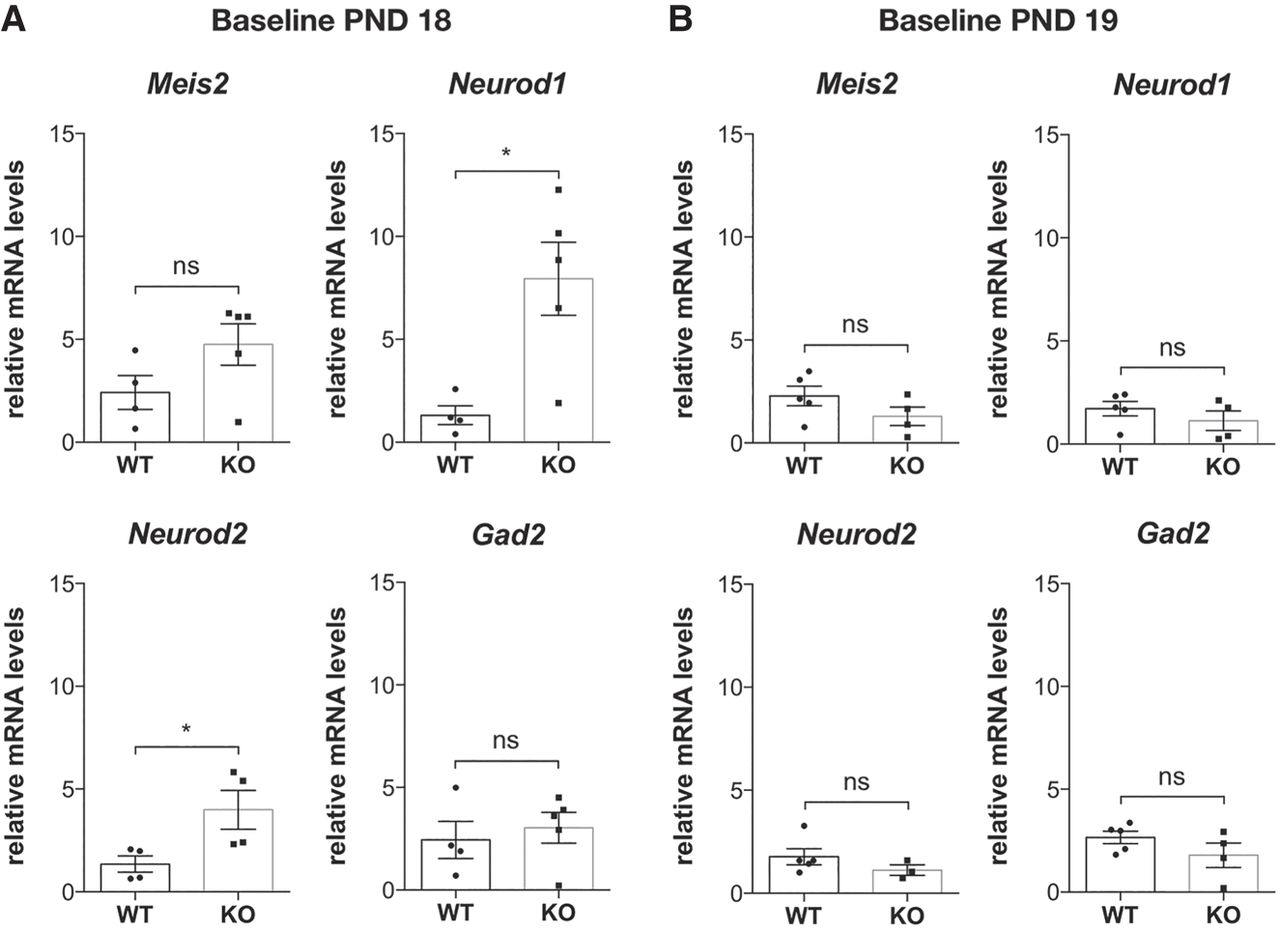
Baseline gene expression at PND 18 and PND 19. (A) At PND 18, mRNA was purified from 5000 GD1 cells; inhibitory and excitatory marker expression levels were quantified by RT-qPCR and compared between WT and Fmr1-KO brains. Baseline marker expression in both genotypes is presented respective to the expression of WT neurons subjected to aiFACS (input WT). Results are presented as the mean ± SEM, Mann–Whitney U test; (*) P < 0.05; (ns) not significant. For Meis2, Neurod1, and Gad2: WT, n = 4; Fmr1-KO, n = 5. For Neurod2: WT, n = 4; Fmr1-KO, n = 4. Each n corresponds to two (nonlittermate) mouse brains and is the mean of two independent replicates. (B) At PND 19, mRNA was purified from 5000 GD1 cells, and inhibitory and excitatory markers expression levels were quantified by RT-qPCR and compared between WT and Fmr1-KO brains. Baseline marker expression in both genotypes is presented respective to the expression of WT neurons subjected to aiFACS (input WT). Results are presented as the mean ± SEM, Mann–Whitney U test; (ns) not significant. For Meis2, Neurod1, and Gad2: WT, n = 5; Fmr1-KO, n = 4. For Neurod2: WT, n = 5; Fmr1-KO, n = 3. Each n corresponds to two (nonlittermate) mouse brains and is the mean of two independent replicates.


