
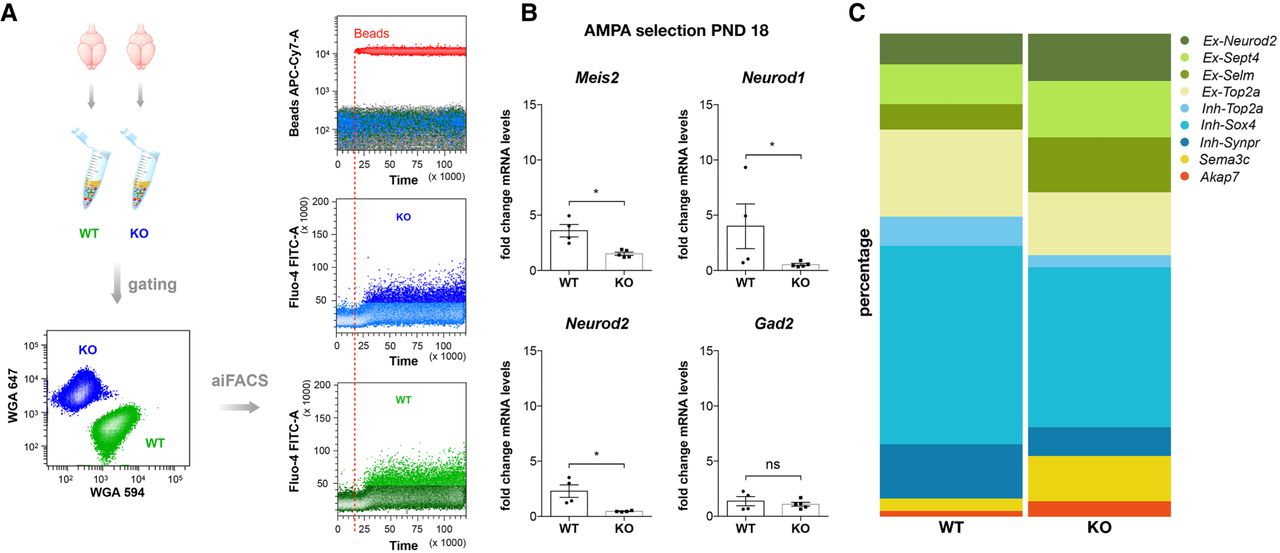
aiFACS multiplex analysis. (A, left) PND 18 WT and Fmr1-KO brains were dissociated, and neuronal cells were selected. Neurons from both genotypes were multiplexed by fluorescent labeling with wheat germ agglutinin (WGA; WGA647 for WT, and WGA594 for Fmr1-KO) and were processed and analyzed simultaneously. (Upper right panel) The injection of fluorescently labeled beads simultaneously with AMPA (130 μM final) perfusion allows the monitoring of the agonist in the flow cell. (Central, lower panels) Real-time monitoring of neuronal responses to AMPA stimulation by Fluo-4 AM fluorescence quantification in Fmr1-KO (blue) and WT (green) cells. (B) mRNA was purified from 5000 GD1 cells, and inhibitory and excitatory marker expression levels were quantified by RT-qPCR and compared for WT and Fmr1-KO. Marker expression upon AMPA stimulation at PND 18 in both genotypes is presented as the fold change respective to the expression of WT neurons subjected to aiFACS (input WT). Results are presented as the mean ± SEM, Mann–Whitney U test; (*) P < 0.05; (ns) not significant. For Meis2, Neurod1, and Gad2: WT, n = 4; Fmr1-KO, n = 5. For Neurod2: WT, n = 4; Fmr1-KO, n = 4. Each n corresponds to two (nonlittermate) mouse brains and is the mean of two independent replicates. (C) Percentage of cells belonging to the nine clusters after single-cell analysis of AMPA response in WT and Fmr1-KO GD1 cells. Ex-Neurod2, Ex-Sept4, Ex-Selm, and Ex-Top2a: excitatory clusters; Inh-Top2a, Inh-Sox4, and Inh-Synpr: inhibitory clusters; Sema3c: ependymal cells; Akap7: oligodendrocytes.


