
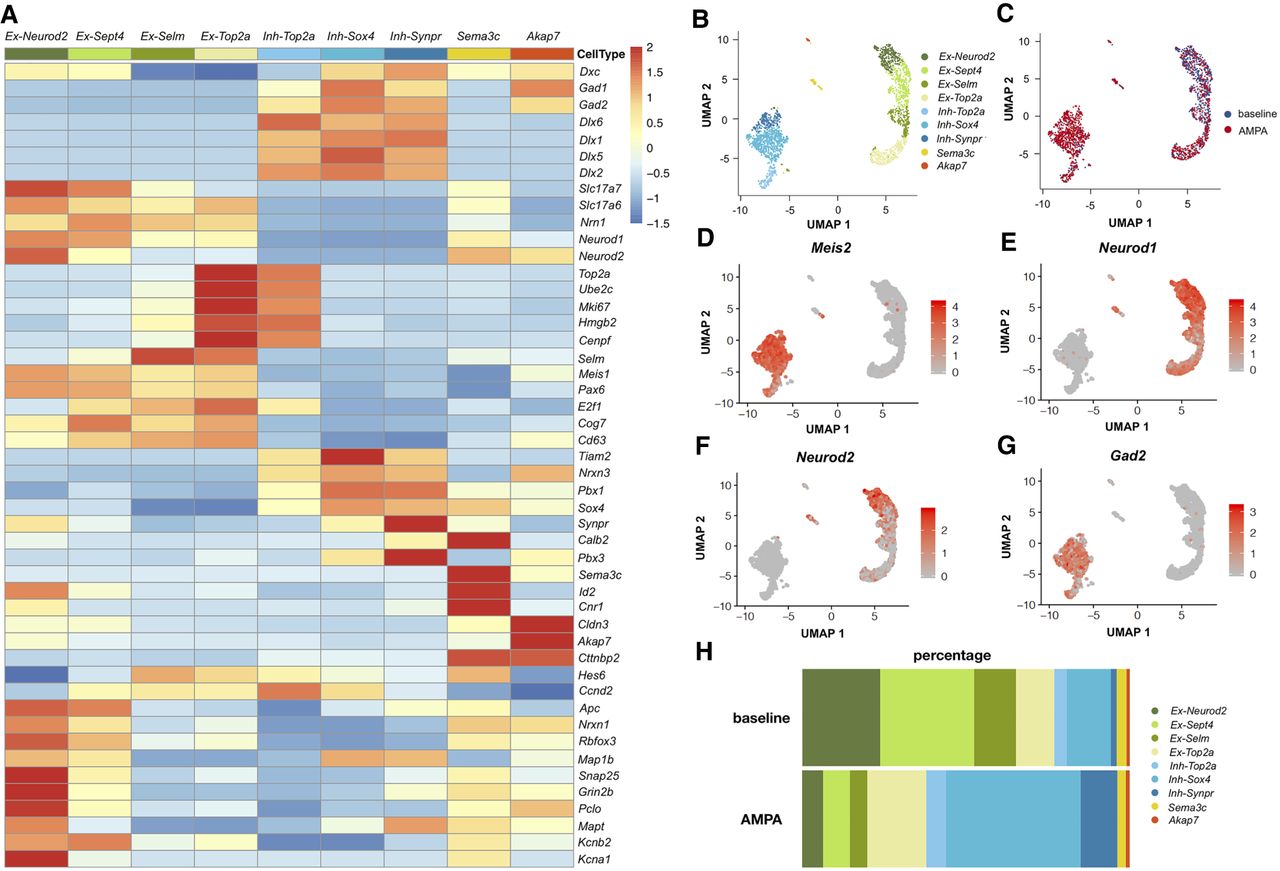
Single-cell transcriptomic analysis of GD1 cells. (A) Heatmap of marker gene expression for the nine identified cell clusters in the aggregated data set before and after stimulation. Ex-Neurod2, Ex-Sept4, Ex-Selm, and Ex-Top2a: excitatory clusters; Inh-Top2a, Inh-Sox4, and Inh-Synpr: inhibitory clusters; Sema3c: ependymal cells; Akap7: oligodendrocytes. (B) UMAP representation of the distribution of the nine clusters. (C) UMAP representation of the two aggregated WT samples: baseline and AMPA. (D) UMAP representation of the Meis2-expressing cell cluster. (E) UMAP representation of the Neurod1-expressing cell cluster. (F) UMAP representation of the Neurod2-expressing cell cluster. (G) UMAP representation of the Gad2-expressing cell cluster. (H) Relative proportion of cells by cluster type for individual samples at the baseline and after aiFACS selection.


