
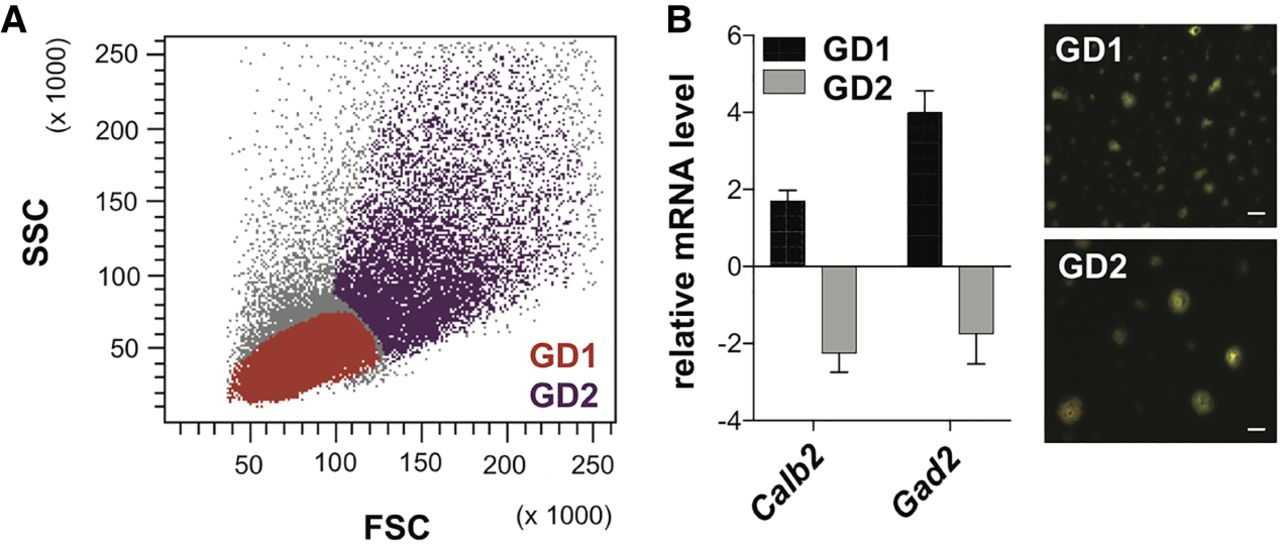
Figure 2.
Gating-dependent cell populations. (A) Discrimination of cells based on scatter parameters: (FSC) forward scatter; (SSC) side scatter. Cells were gated according to their size/structure. (GD1) Gating-dependent cell population 1; (GD2) gating-dependent cell population 2. (B) RNA was purified from WT GD1 and GD2 cells. Neuronal and nonneuronal marker levels were analyzed in both populations by RT-qPCR. The graph (on the left) shows mRNA expression relative to the total WT neuron suspension (WT input). GD1 and GD2 cells were live-imaged 2 h after aiFACS sorting (on the right). 63× magnification; scale bars, 15 μm.


