
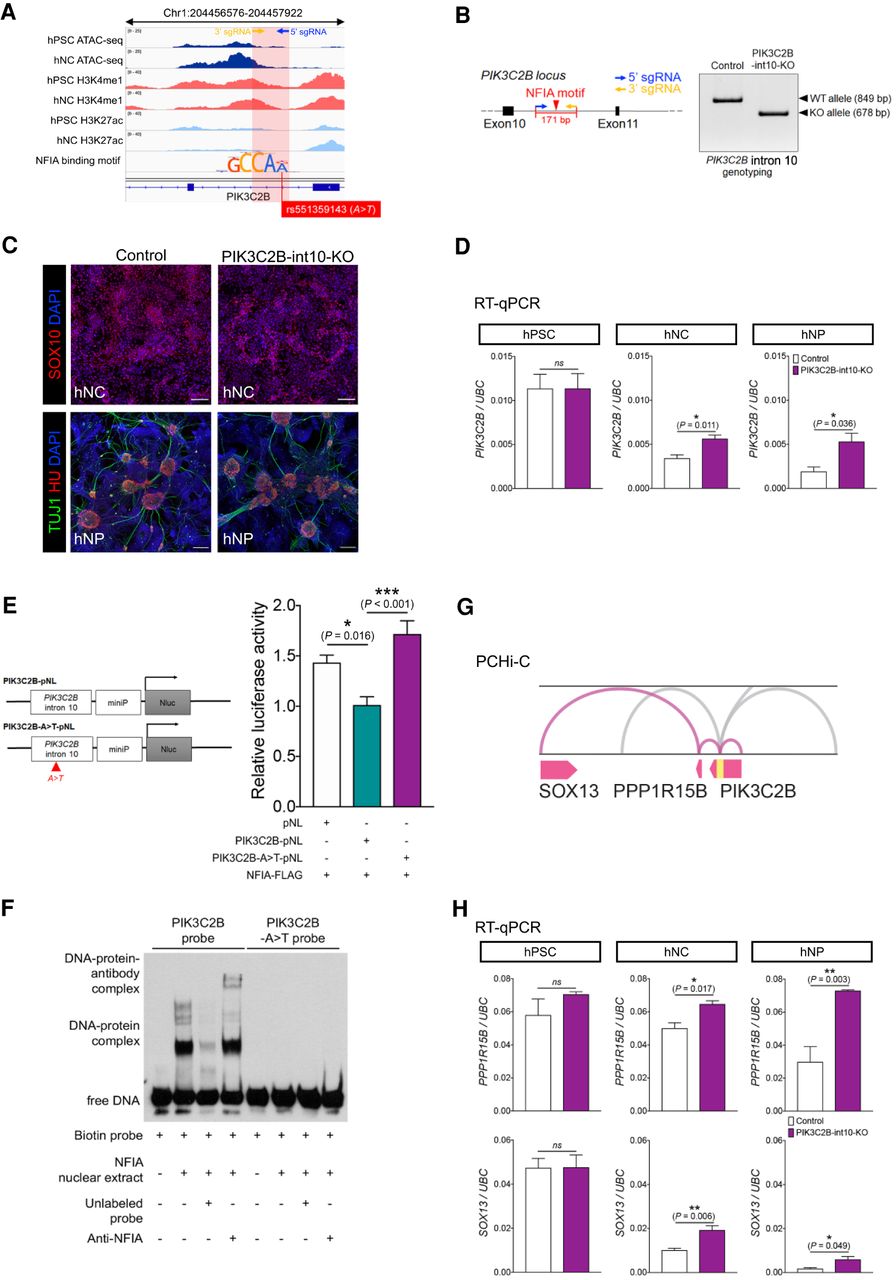
Characterization of a novel S-HSCR-associated regulatory element in intron 10 of PIK3C2B. (A) Overview of ATAC-seq and ChIP-seq profiles showing the putative hNC-specific regulatory element in PIK3C2B intron 10. The red shaded region indicates the location of the regulatory element and the line shows the A > T variant (rs551359143) found exclusively in the S-HSCR cases that disrupts the NFIA binding motif. The motif is not drawn to the same scale as the genomic signal tracks, with magnified characters. (B) Design of sgRNAs used for the CRISPR-Cas9 system for deleting the regulatory element. Genotyping reveals the specific deletion of the 171-bp fragment in intron 10 of PIK3C2B in the PIK3C2B-int10-KO hPSC line. (WT) Wild type, (KO) knockout. (C) Immunostaining shows that both the control and mutant (PIK3C2B-int1-KO) lines have comparable capability to make hNCs and hNPs. Scale bars: (hNC) 100 μm; (hNP) 200 μm. (D) RT-qPCR shows the changes in the expression of PIK3CB in different cell stages in the control and mutant lines. t-test, (ns) not significant. n = 3–4 per group. (E) Design of the constructs used for the luciferase assay. The bar chart shows the relative luciferase activities when the cells were transfected with different sets of constructs as indicated. Three independent assays were performed, each in triplicate. One-way ANOVA. (F) Gel mobility shift assays were performed with biotin-labeled probes containing the PIK3C2B intron 10 regulatory element with or without the A > T conversion and the nuclear extract from NFIA-overexpressing cells, in the presence of unlabeled probes or anti-NFIA antibody (0.1 µg). (G) Significant contacts (FDR < 0.05) in the promoter capture Hi-C data from GM12878 cells at the PIK3C2B locus. The putative regulatory element in intron 10 of PIK3C2B is marked in yellow. Contacts between the regulatory element and the TSSs of SOX13, PPP1R15B, and PIK3C2B are shown in purple curves, while contacts between the regulatory element and other promoters are shown in gray curves. Contacts that extend too far are trimmed. (H) RT-qPCR analysis shows the changes in the expression of PPP1R15B and SOX13 in the control and the mutant lines at different cell stages. t-test, (ns) not significant. n = 3–4 per group.


