
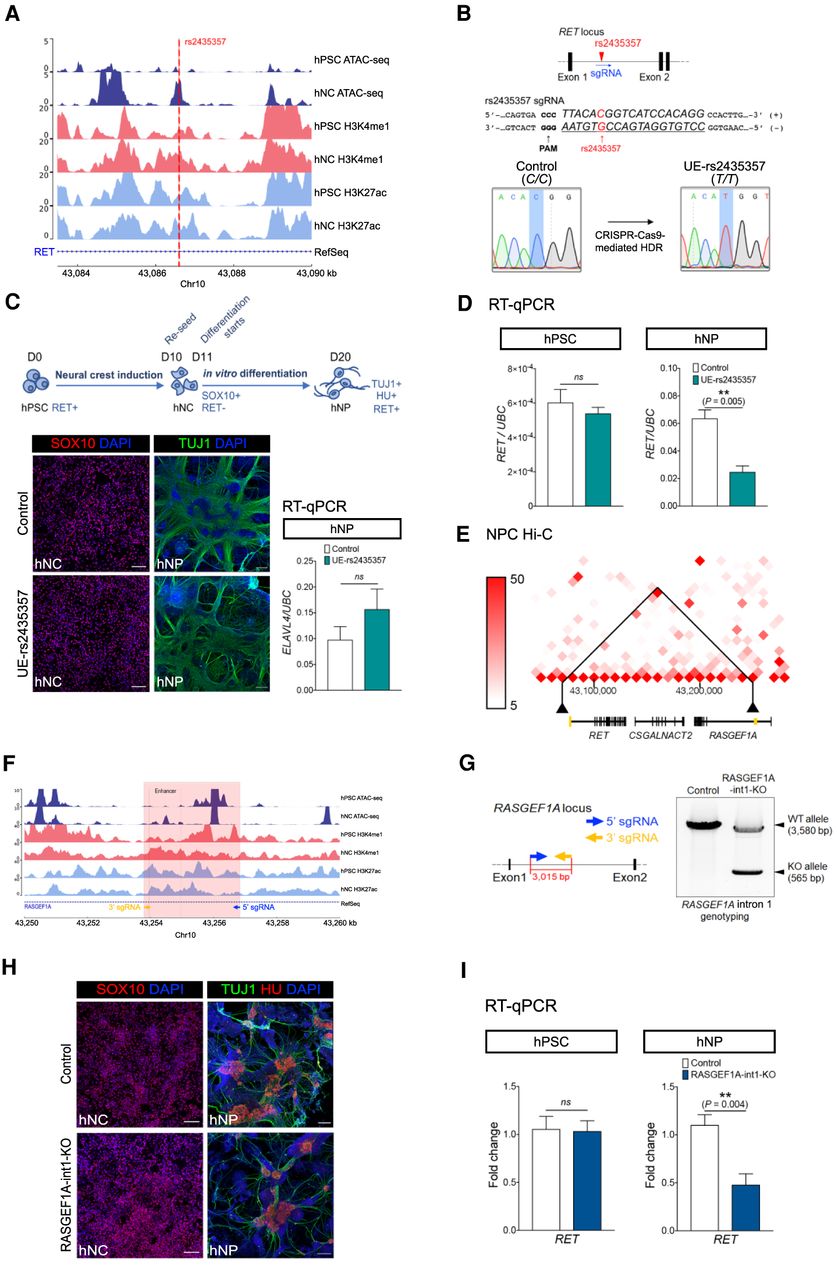
Functional impacts of a HSCR-associated SNP (rs2435357) and the deletion of a novel S-HSCR enhancer on RET expression. (A) ATAC-seq and ChIP-seq profiles of hPSC and hNC in intron 1 of RET show that rs2435357 is residing in a hNC-specific ATAC-seq peak. (B) Location of rs2435357 in the RET gene locus and in the sgRNA used for CRISPR-Cas9-mediated HDR for editing the C allele to the HSCR-associated risk allele T. The electrographs of Sanger sequencing show the successful introduction of the risk allele at rs2435357 in the UE-rs2435357 hPSC line. (C) Differentiation strategy to generate human neural crest (hNC) and neuronal progenitor (hNP). HU is encoded by the ELAVL4 gene. Immunostaining of SOX10 and TUJ1 in hNC and hNP of the control and the mutant (UE-rs2435357) lines. Scale bars: (hNC) 100 μm; (hNP) 200 μm. RT-qPCR analysis showing the comparable ELAVL4 expression level in hNP in the control (n = 5) and the mutant (UE-rs2435357) (n = 3) lines. t-test, (ns) not significant. (D) RT-qPCR analysis showing RET expression in the hPSC and hNP stages of the control (n = 5) and the mutant (UE-rs2435357) (n = 3). t-test, (ns) not significant. (E) Hi-C data from neural progenitor cells show that the enhancer in intron 1 of RASGEF1A (marked in yellow on the right) has physical interaction with the promoter of RET (marked in yellow on the left) at 10-kbp bin size. (F) ATAC-seq and ChIP-seq data from hPSC and hNC at the RASGEF1A intron 1 locus. (G) The design of sgRNAs used for the CRISPR-Cas9 system for deleting the DNA fragment in RASGEF1A intron 1. Genotyping reveals the specific deletion of RASGEF1A intron 1 in the UE-RASGEF1A-int1-KO hPSC line. (WT) Wild type, (KO) knockout. (H) Immunostaining of SOX10, TUJ1, and HU in hNC and hNP of the control and the mutant (RASGEF1A-int1-KO) lines, respectively. Scale bars: (hNC) 100 μm; (hNP) 200 μm. (I) RT-qPCR reveals the expression level of RET in the hPSC and hNP stages of the control (n = 4–5) and the mutant (RASGEF1A-int1-KO) (n = 6–7). t-test, (ns) not significant.


