
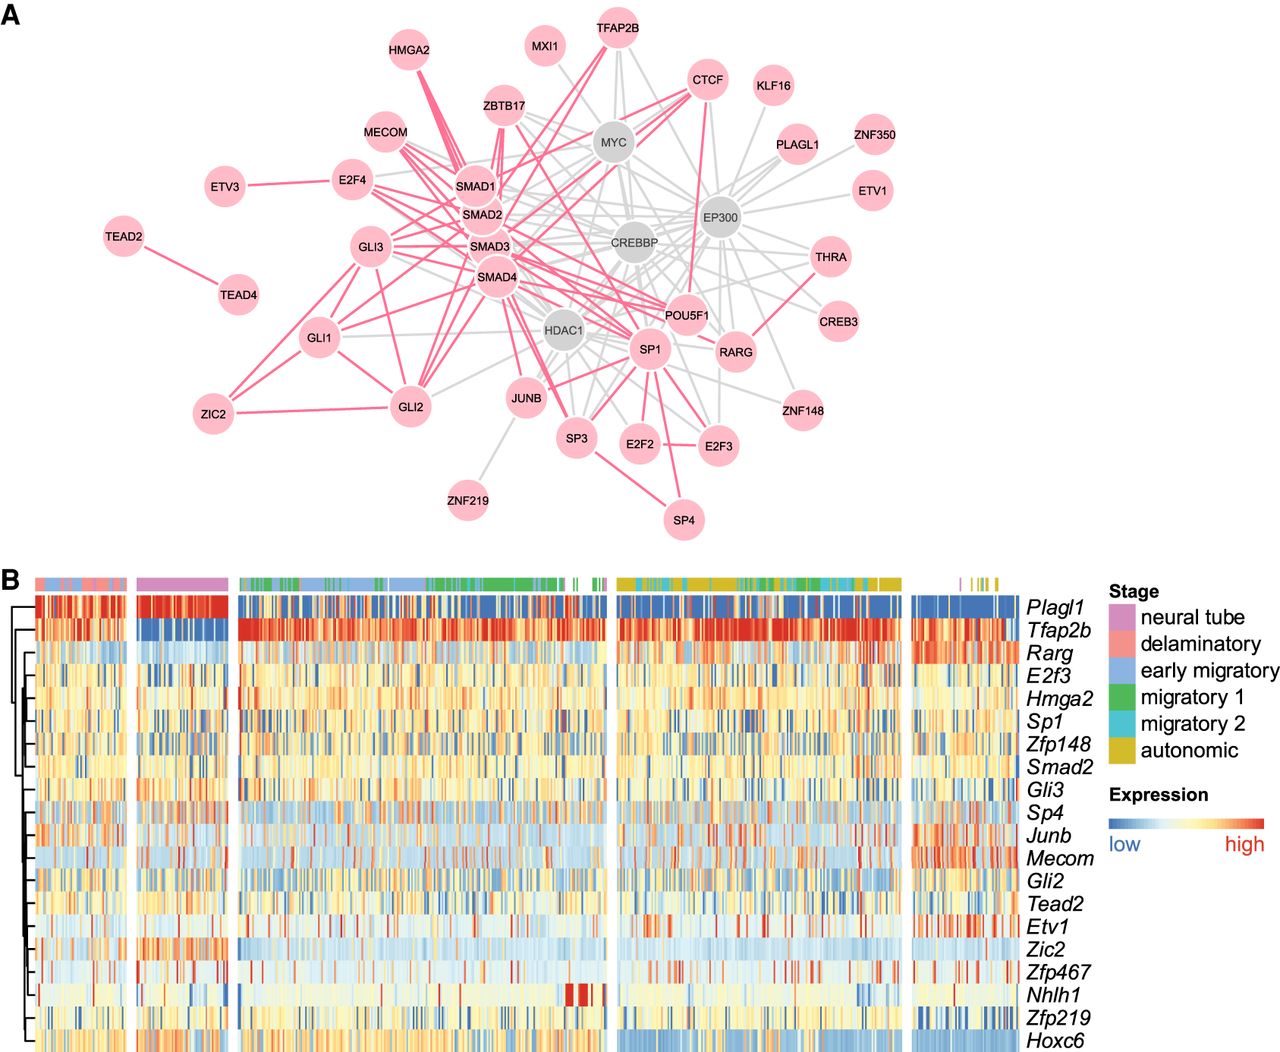
Figure 4.
Analysis of the recurrent TFs. (A) PPIs among the recurrent TFs (red) and several other proteins frequently interacting with them (gray). Direct interactions among the recurrent TFs are shown in red, while direct interactions involving the other proteins are shown in gray. Recurrent TFs that have no interactions with other proteins in this figure are excluded. (B) Spatiotemporal expression of recurrent TFs with stage-specific expression profiles in mouse trunk NCs. The heat map was produced in the same way as in Figure 3C, with the same order of columns.


