
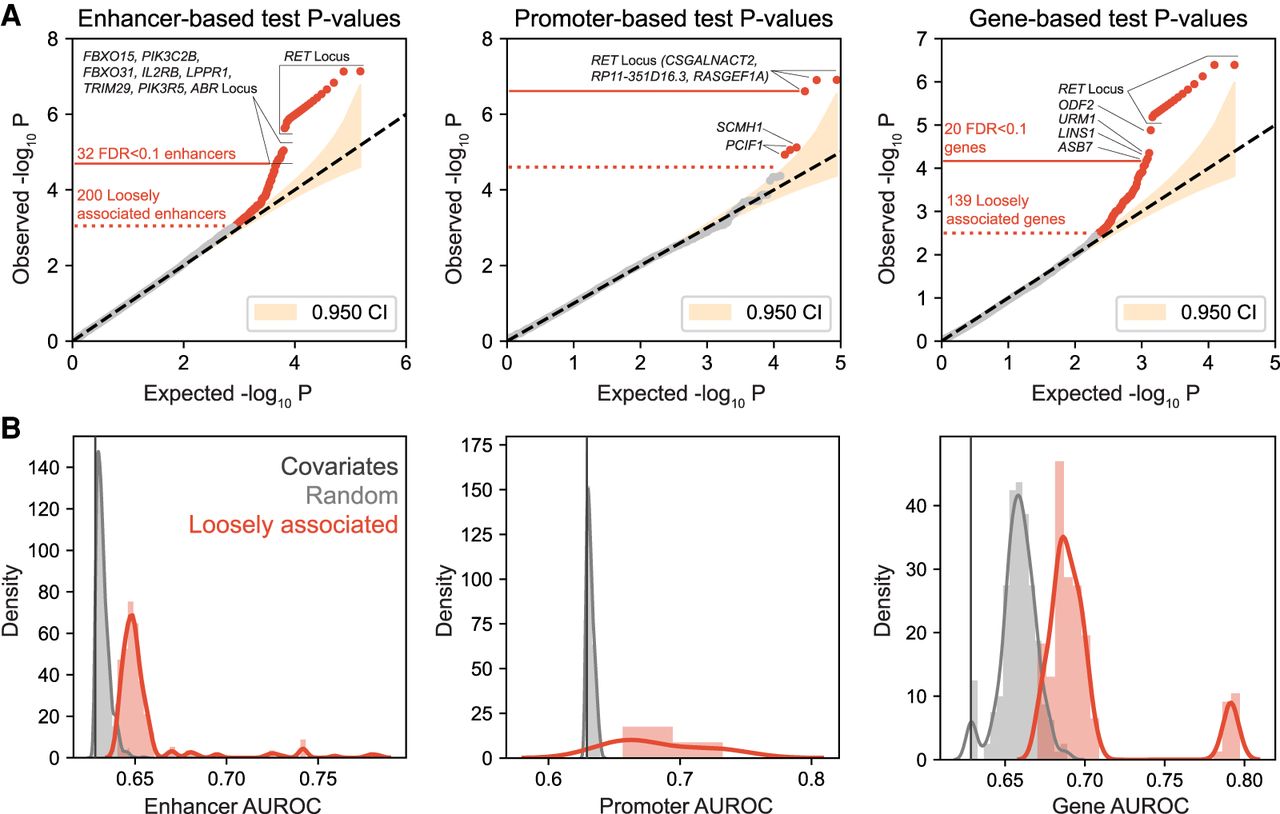
Association test results. (A) Q-Q plots of association P-values in the enhancer-based, promoter-based, and gene-based tests. In each plot, the yellow shaded area shows the 95% confidence interval. The dotted red line marks the demarcation point of the loosely associated regions, above which all the regions are outside the 95% confidence interval. The solid red line marks the threshold for significantly associated regions, above which all regions have an FDR Q-value < 0.1. The significantly associated regions are a subset of the loosely associated regions. (B) Comparison of the AUROC value distributions of the models of the loosely associated regions with those of the models of the background regions and the covariate-only model.


