
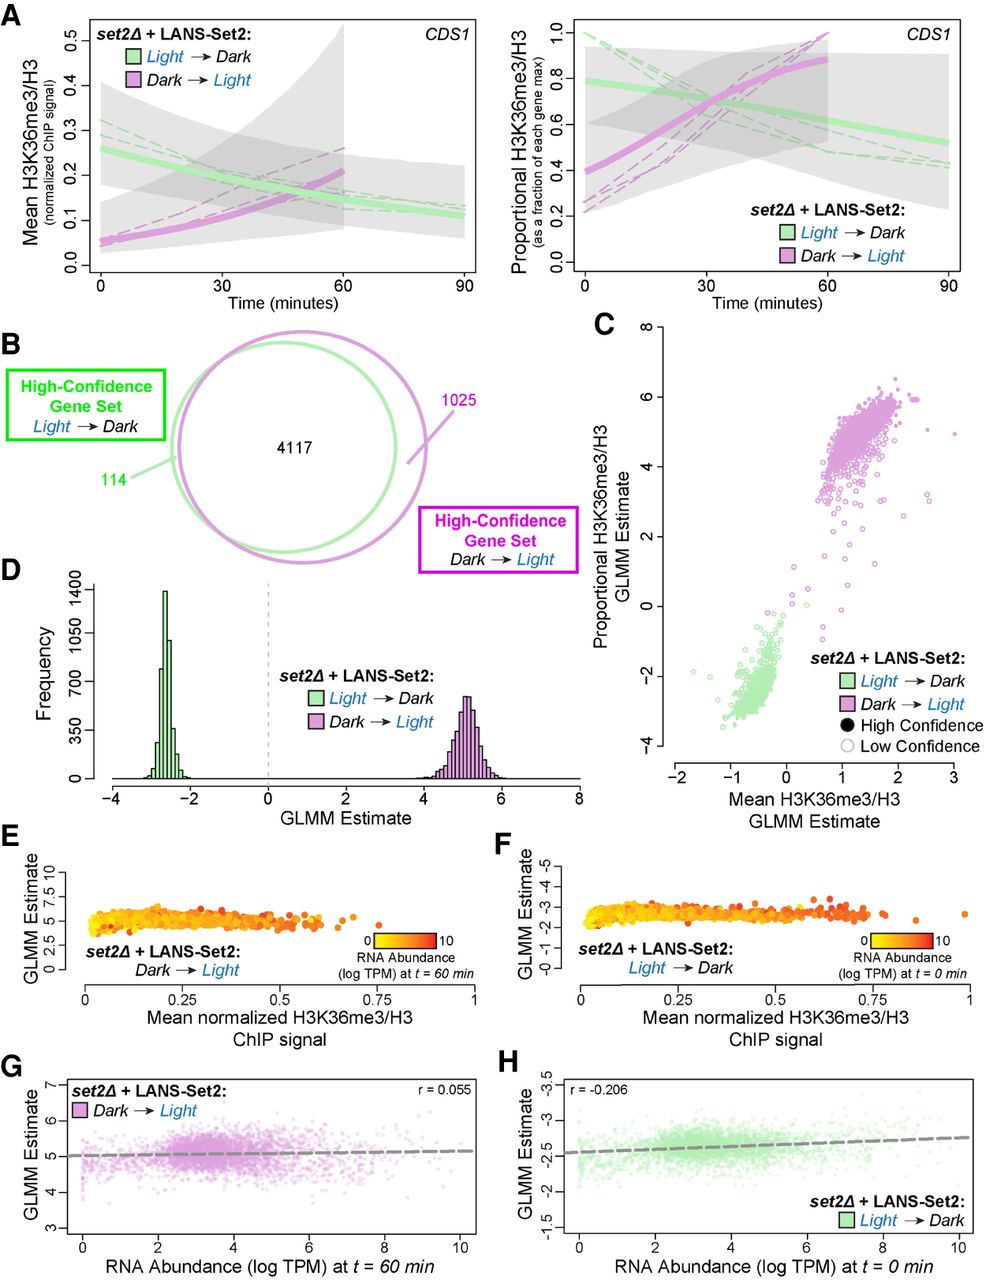
A statistical model of H3K36me3 dynamics defines fixed and stochastic properties of H3K36me3 gain and loss. (A) Posterior H3K36me3 rates from Bayesian generalized linear mixed model (GLMM) for normalized ChIP-seq signal (left) and relative H3K36me3 ChIP-seq signal (right) for the gene CDS1 (YBR029C) throughout the time courses of LANS-Set2 activation (green) and LANS-Set2 inactivation (purple). Dashed lines represent individual ChIP-seq replicates, and bold lines represent the GLMM posterior mean of the rate. Shaded regions indicate the 95% credible interval on the rate parameter. (B) Venn diagram of the high-confidence genes identified within LANS-Set2 activation (green) and LANS-Set2 inactivation (purple). High-confidence genes had a clear positive or negative rate, defined as having 95% credible intervals that never include zero (on the linear predictor). (C) Per-gene GLMM rates for normalized H3K36me3 ChIP-seq signal and relative H3K36me3 ChIP-seq signal for both LANS-Set2 activation (green) and LANS-Set2 inactivation (purple). Solid circles signify high-confidence genes, whereas hollow circles represent low-confidence genes. (D) Histogram of GLMM rates within the shared high-confidence gene set between LANS-Set2 activation (green) and LANS-Set2 inactivation (purple) (n = 4117). (E) LANS-Set2 activation GLMM rates compared to average, normalized H3K36me3 ChIP-seq levels at t = 60 min for each gene in the shared, high-confidence gene set. Each gene is colored by mean RNA abundance levels (log TPM) at the same time point. (F) LANS-Set2 inactivation GLMM rates compared to average, normalized H3K36me3 ChIP-seq levels at t = 0 min for each gene in the shared, high-confidence gene set. Each gene is colored by mean RNA abundance levels (log TPM) at the same time point. (G) LANS-Set2 activation GLMM rates compared to mean RNA abundance levels (log TPM) at t = 60 min for genes that were high confidence for both LANS-Set2 activation and inactivation. The Pearson correlation coefficient is r = 0.055. The dashed lines represent the line of best fit. (H) LANS-Set2 inactivation GLMM rates compared to mean RNA abundance levels (log TPM) at t = 0 min for genes that were high-confidence gene in both sets. Pearson correlation coefficient is r = 0.206. Dashed line represents the line of best fit.


