
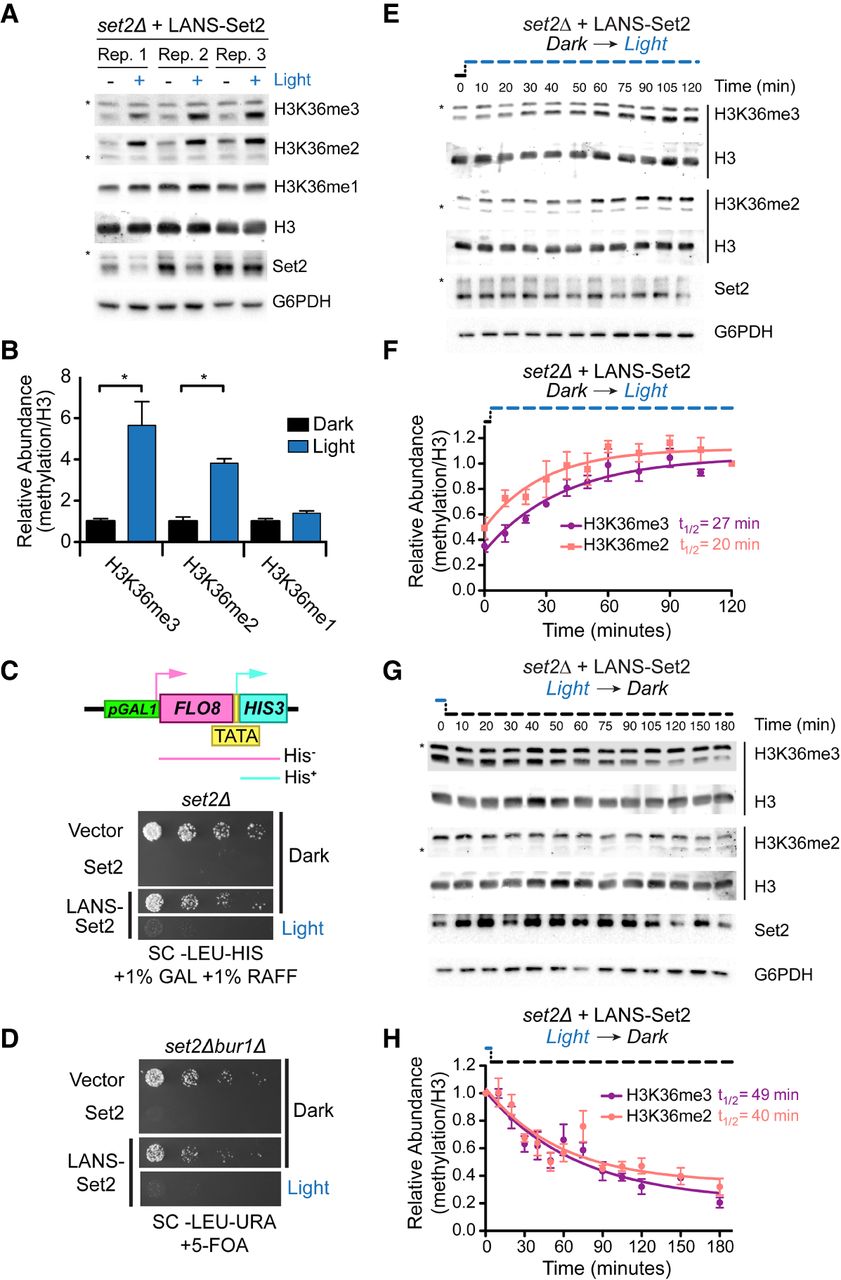
LANS-Set2 regulates H3K36 methylation levels and Set2-associated phenotypes. (A) Western blot analysis comparing levels of H3K36 methylation in whole-cell lysates prepared from log-phase cultures grown continuously in the dark or light. Asterisks indicate nonspecific bands. (B) Quantification of histone modifications from immunoblots in A. Data represent mean values ± SD (n = 3). (*) P < 0.05. (C, top) Diagram of the FLO8-HIS3 reporter. The promoter upstream of the FLO8 gene has been replaced by a galactose-inducible promoter and a HIS3 cassette has been inserted out of frame from the FLO8+1 ATG such that growth in the absence of histidine can only occur when transcription initiates from an internal TATA located at FLO8+1626. (Bottom) Fourfold serial dilutions of overnight set2Δ cultures expressing one of several constructs were spotted on the indicated solid media, which were incubated in the dark or light for 4 d before imaging (for original images, see Supplemental Fig. S1F). LANS-Set2 phenocopies set2Δ in the dark and wild-type Set2 in the light. (D) Fivefold serial dilutions of overnight cultures of wild-type BY4742 and BUR1 plasmid shuffling strains were spotted on the indicated solid media, which were incubated in the dark or light for 3 d before imaging (for original images, see Supplemental Fig. S1G). LANS-Set2 phenocopies set2Δbur1Δ in the dark and wild-type Set2 in the light. (E) Representative western blot analysis of whole-cell lysates probing gain of H3K36 methylation over time using LANS-Set2 in set2Δ after the transition of log-phase cultures from dark to light (for replicates, see Supplemental Fig. S2A). Asterisks indicate nonspecific bands. (F) Quantification of H3K36 modifications as a function of time from triplicate immunoblots shown in E and Supplemental Figure S2A. n = 3 and data represent mean ± SEM. (G) Representative western blot analysis of whole-cell lysates probing loss of H3K36 methylation over time using LANS-Set2 in set2Δ after the transition of log-phase cultures from light to dark (for replicates, see Supplemental Fig. S2B). Asterisks indicate nonspecific bands. (H) Quantification of H3K36 modifications as a function of time from triplicate immunoblots shown in G and Supplemental Figure S2B. n = 3 and data represent mean ± SEM. Half-lives were calculated from single exponential fits to the H3K36me3 and H3K36me2 relative abundance data using GraphPad Prism 5.


