
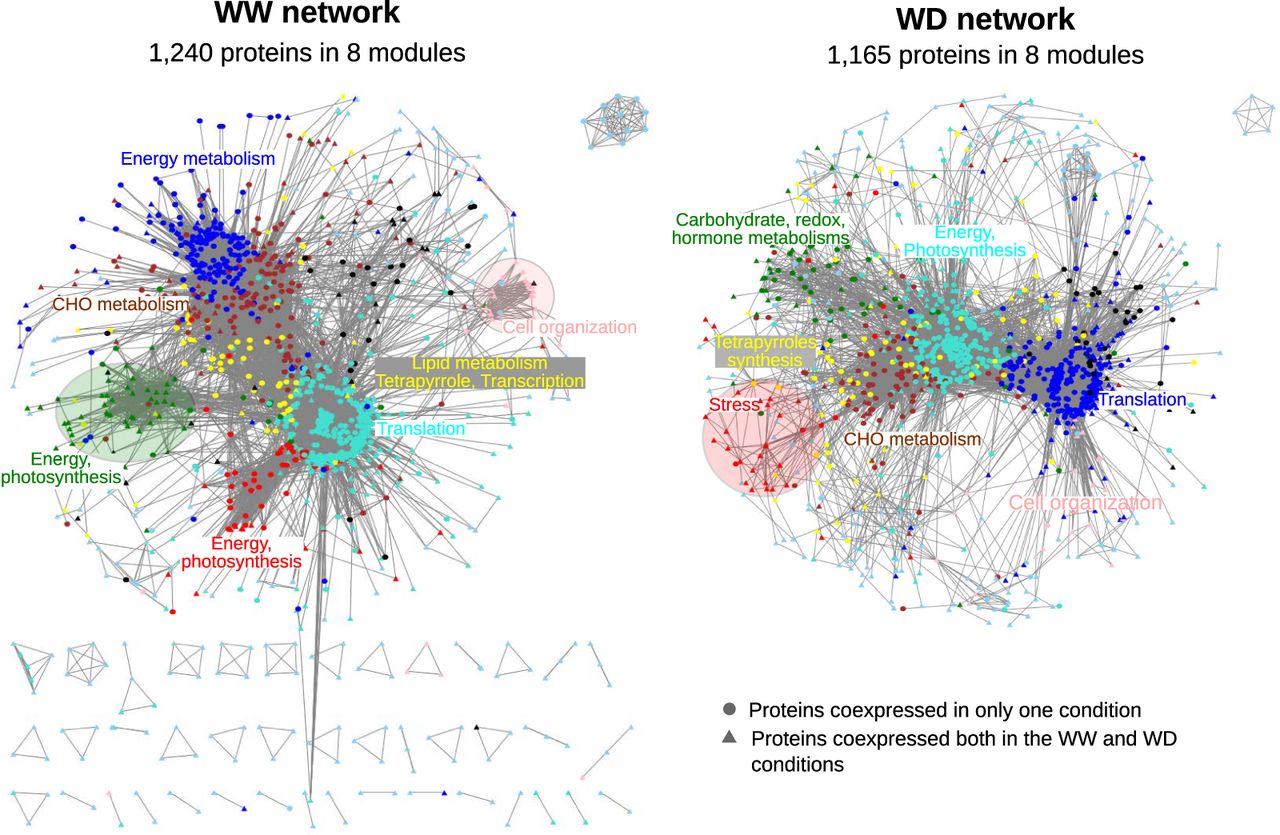
Figure 4.
Graphical representation of the coexpression networks resulting from the WGCNA analysis. Only proteins with an adjacency >0.02 are shown. The two views were created by Cytoscape v3.5.1 using an unweighted, spring-embedded layout (cytoscape files are available in Supplemental File S1). The colors displayed on each network represent the different modules identified by WGCNA. Functional enrichments of modules are indicated with corresponding colors. Condition-specific modules are circled. Each module contains 35–471 proteins.


