
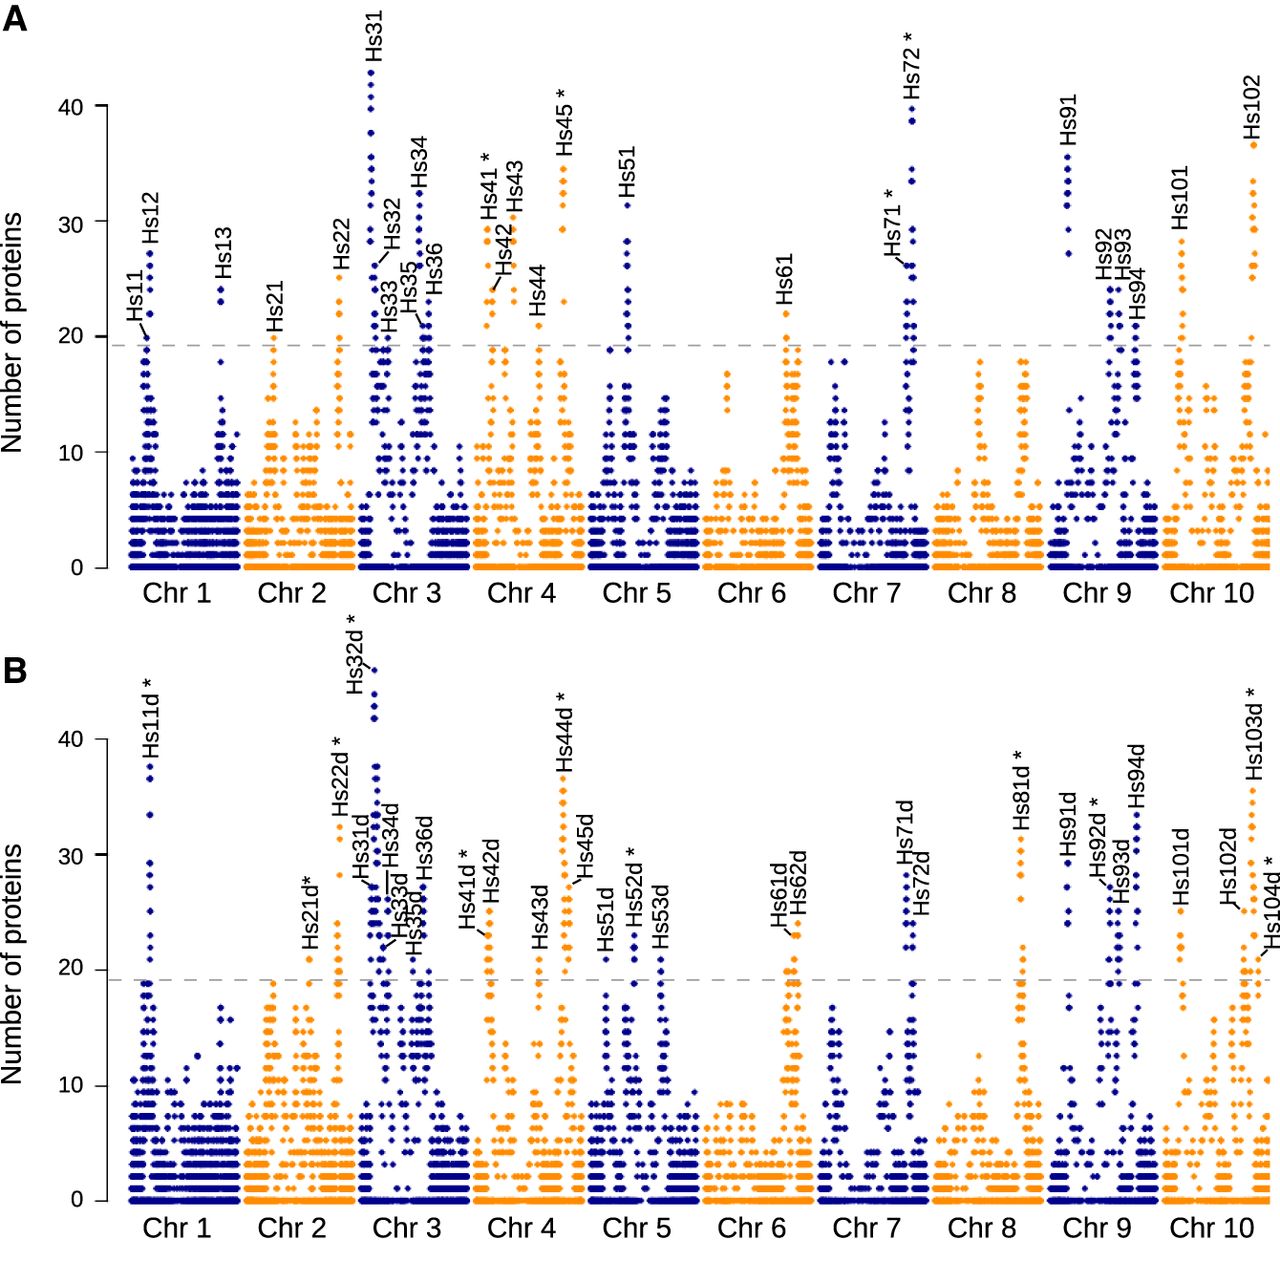
Figure 3.
Distribution of pQTLs across the genome. (A) In the well-watered condition. (B) In the water deficit condition. Each point indicates the number of proteins associated with a pQTL located within a given genomic region defined by the linkage disequilibrium interval around an SNP. Dashed horizontal lines indicate the threshold used to detect pQTL hotspots. Names and positions of the pQTL hotspots are indicated above each graph. Asterisks indicate the pQTL hotspots confidently detected as loci with potential pleiotropic effects (for details, see Supplemental Table S4).


