
Figure 2.
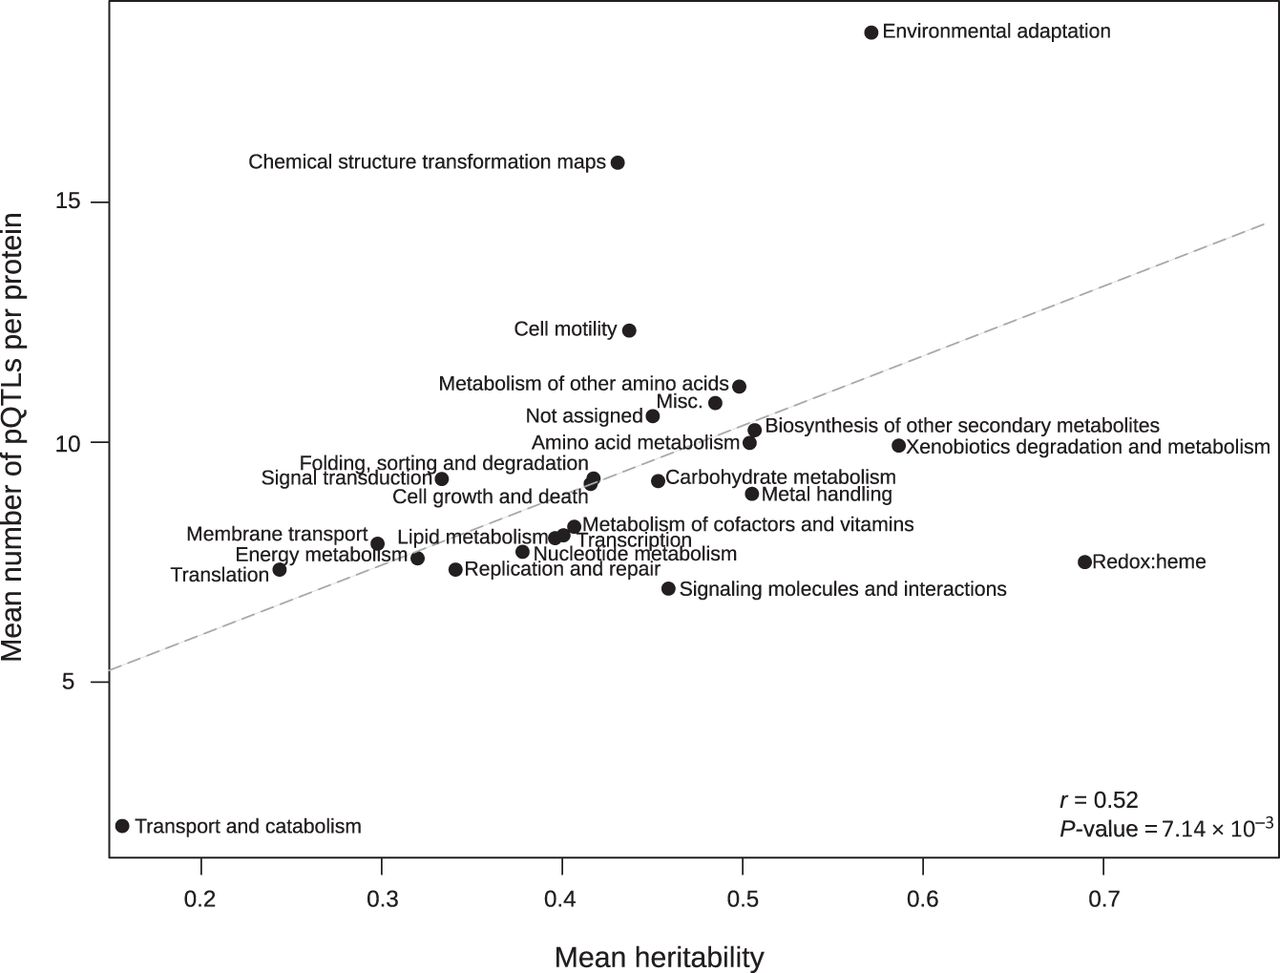
Relationship between the mean number of pQTLs per KEGG category and the mean heritability per KEGG category.
(Downloading may take up to 30 seconds. If the slide opens in your browser, select File -> Save As to save it.)
Click on image to view larger version.
Relationship between the mean number of pQTLs per KEGG category and the mean heritability per KEGG category.
 CiteULike
 Delicious
 Digg
Digg Facebook
 Google+
 Reddit
 Twitter
