
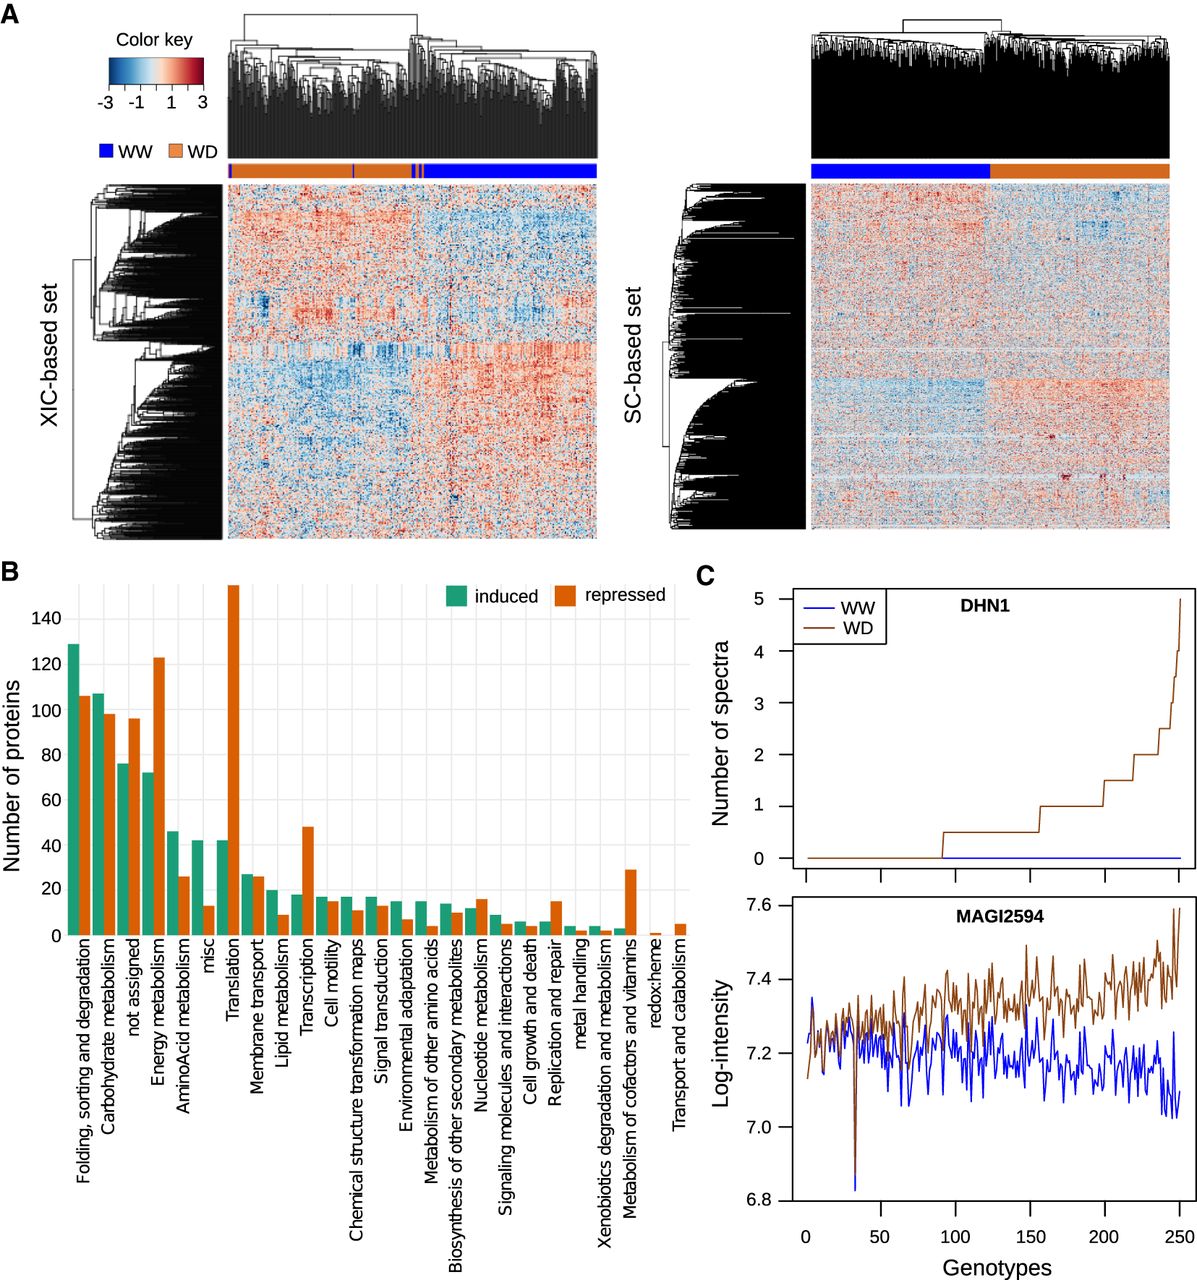
Effect of mild water deficit on the proteome. (A) Heatmap representations of protein abundances estimated for the XIC-based protein set (left) and the SC-based protein set (right). Each line corresponds to a protein and each column to a genotype × watering condition combination. For each protein, abundance values were scaled and represented by a color code as indicated by the color key bar. Hierarchical clustering of the genotype × watering condition combinations (top) and of the proteins (left) was built using the 1 − Pearson correlation coefficient as the distance and the unweighted pair group method with arithmetic mean (UPGMA) as the aggregation method. (B) Functions of the induced and repressed proteins under water deficit. (C) Abundance profiles of the DHN1 dehydrin (GRMZM2G079440 quantified based on the number of spectra) and of the MAGI2594 protein (GRMZM2G352415, a LEA protein quantified based on peptide intensity) in the two watering conditions. Genotypes on the x-axis were ordered according to the WD/WW abundance ratio. The lists of genotypes in this order are available in Supplemental Table S2.


