
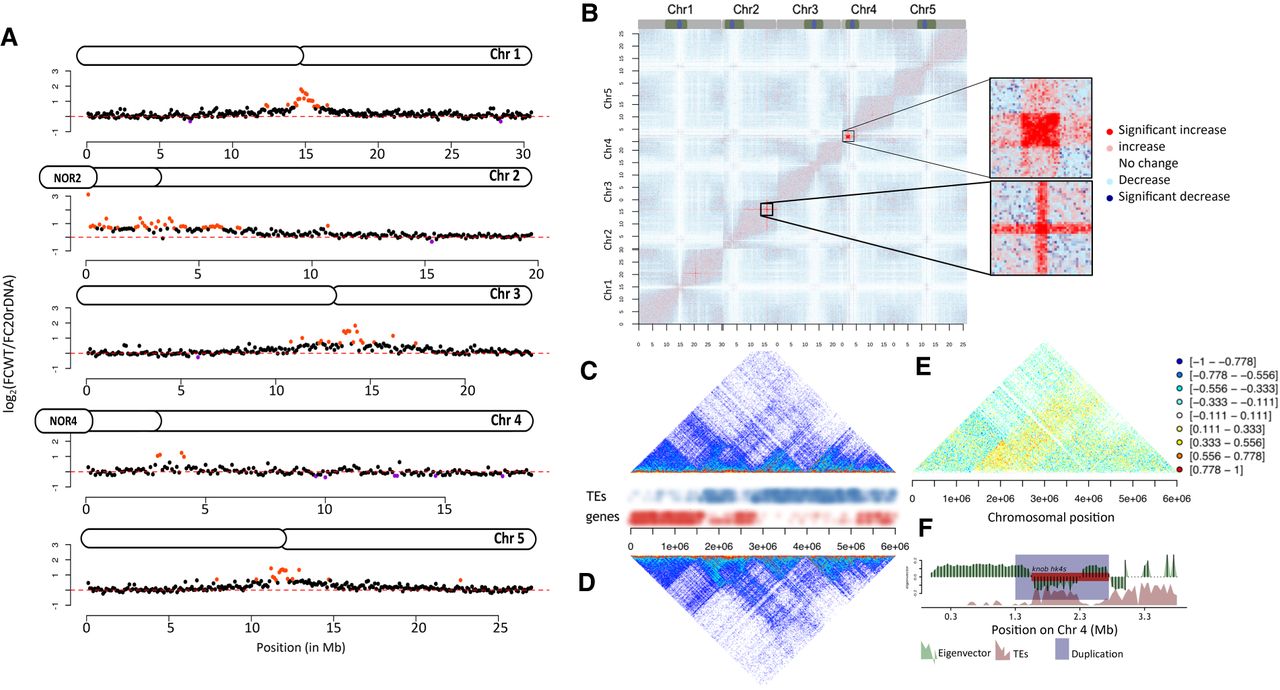
3D genome organization in L6F6. (A) Chromosome plots displaying the relative enrichment of a given genomic segment with the nucleolus. The y-axis displays the fold change nucleolus enrichment between wild-type Col-0 and the 20rDNA L6F6. Each dot represents a 100-kb window. Nucleolus-enriched genomic regions above the threshold are red, and depleted regions are violet. (B) Coverage-normalized t-test difference matrix (50-kb bins). The color of each pixel of the matrix is defined by the result of a t-test using the triplicate contact frequencies from wild-type and 20rDNA coverage-normalized Hi-C samples. The two magnified areas correspond to the two regions displaying the highest level of contact frequency changes. (C,D) Non-normalized Hi-C snapshot showing the contact frequencies on the short arm of Chromosome 4 in wild-type Col-0 (C) versus the 20rDNA L6F6 (D). TEs and genes are annotated to illustrate the occurrence of euchromatin and heterochromatin, respectively. (E) Ratio between Hi-C contact frequencies from wild-type and 20rDNA L6F6. Negative ratios correspond to more contacts in the wild type, whereas positive ratios correspond to more contacts in the 20rDNA L6F6. (F) Eigenvector of the wild-type Co-0 Hi-C data set and annotation of the TDDO4 affecting the knob hk4s. Note the central duplication breakpoint exactly coincides with a change between LSD and a CSD.


