
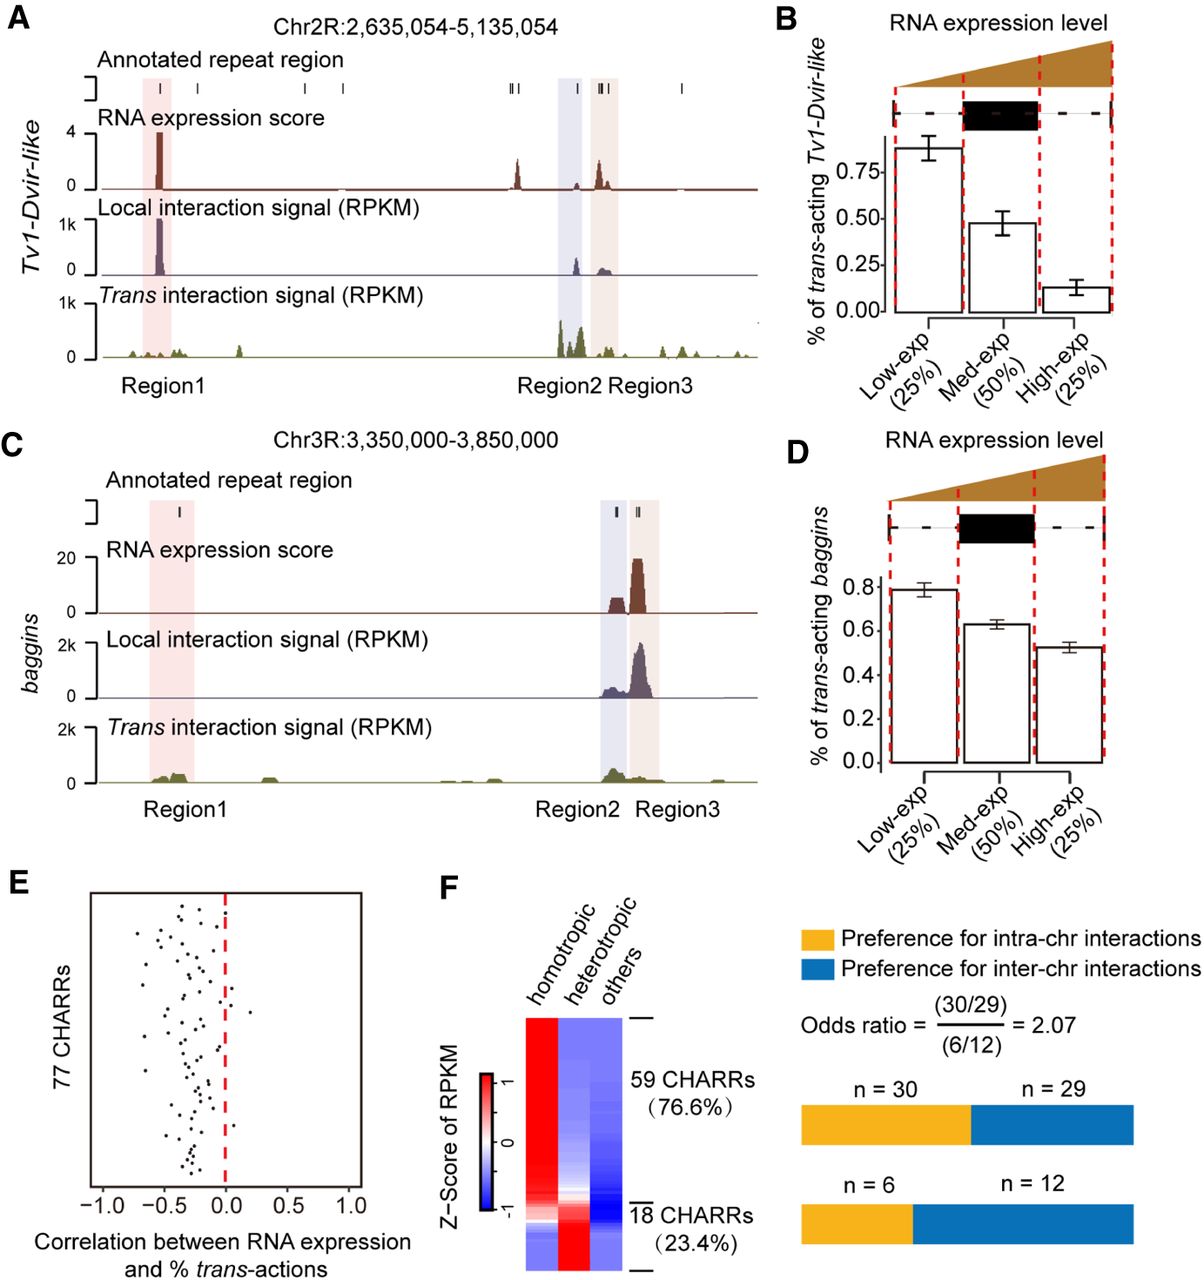
Reverse correlation between local transcription and association with trans-acting RNAs on chromatin. (A) A representative genomic region showing Tv1-Dvir-like transcription loci and interactions with Tv1-Dvir-like subfamily RNAs produced either locally or from other chromosomes (trans-acting RNAs). Three annotated Tv1-Dvir-like transcription regions are indicated at the bottom. (B) Tv1-Dvir-like subfamily-derived RNAs were segregated into three groups according to their levels of transcription (bottom 25%, middle 50%, and top 25%). Bars indicate the percentage of trans-acting Tv1-Dvir-like RNAs on the transcription loci in each group. (C,D) Similar analysis and illustration for another typical CHARR baggins as in A and B. (E) Pearson's correlation for individual CHARRs between their expression and the percentage of associated trans-acting RNAs from the same subfamilies. (F) Tendencies of CHARRs engaging homotropic versus heterotropic interactions based on normalized reads per kilobase per million (left). The two classes of CHARRs were further separated into those with preference for inter- (yellow) or intra- (blue) chromosomal interactions (right), as indicated in Figure 4.


