
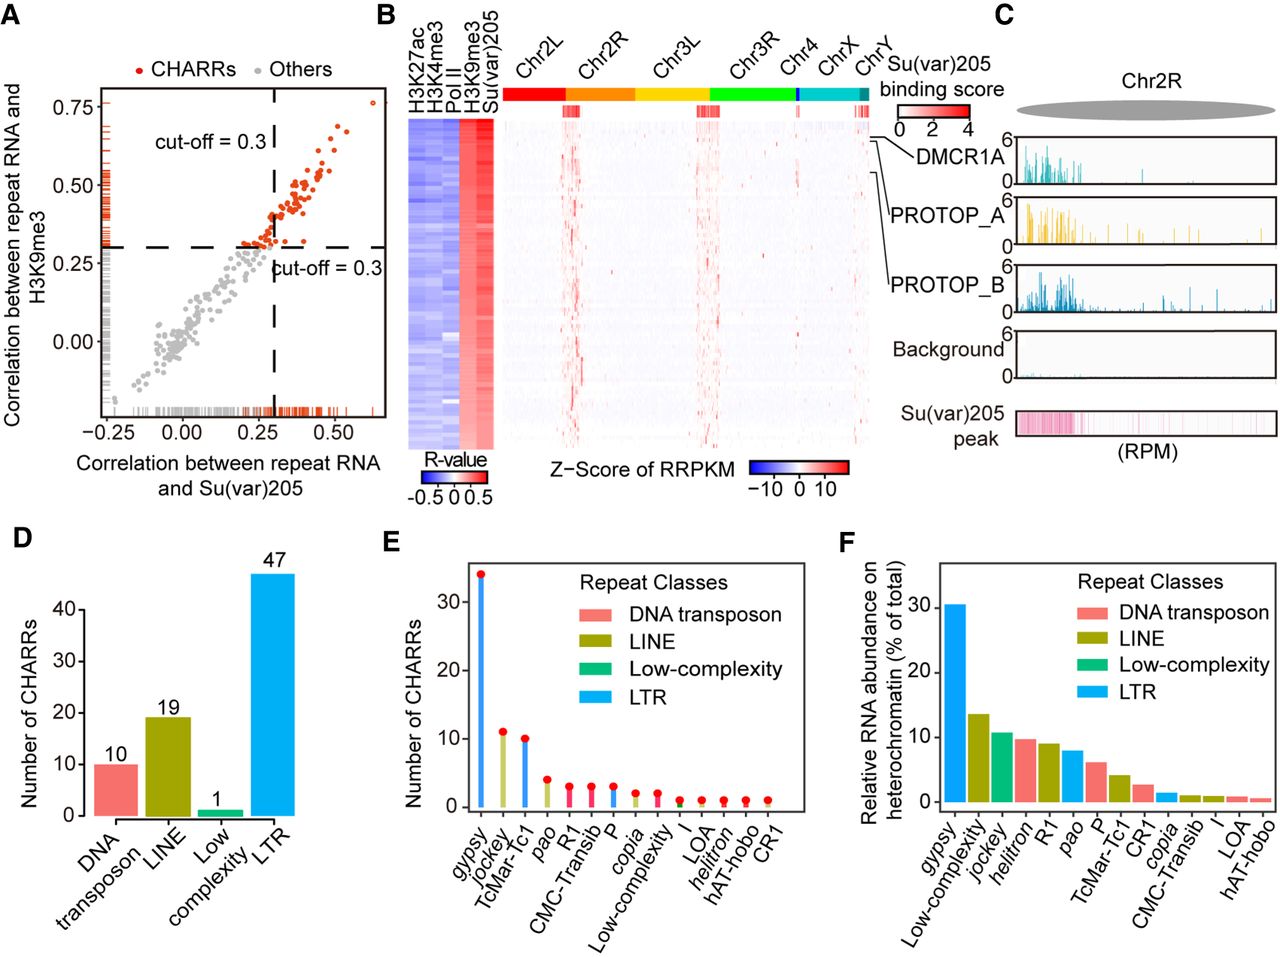
Prevalent association of gypsy-derived RNAs with constitutive heterochromatin. (A) Scatterplot of colocalization coefficients between repeat-derived RNA signals on DNA and the levels of H3K9me3 (y-axis) or HP1 (x-axis) in S2 cells. A threshold of 0.3 was chosen for both chromatin marks (red lines). Dashed lines were used to differentiate CHARRs (red dots) from other repeat-derived RNAs (gray dots). (B) Left: Heat map of colocalization of each CHARR with individual chromatin marks or Pol II ChIP-seq signals. Right: Heat map of chromatin interaction of each CHARR with AluI-generated DNA bins, which were merged from 100 continuous AluI DNA bins. HP1 binding signals in these DNA bins are displayed below the schematic presentation of Drosophila chromosomes. Three representative CHARRs are labeled on the right. (C) Chromatin interaction signals of three representative CHARRs, DMCR1A, PROTOP_A, and PROTOP_B on a genomic region in Chromosome 2R in comparison with nonspecific background based on human RNA mapped to fly DNA and HP1 binding density. All signals were scaled to reads per million. (D,E) The number of repeat classes (D) or subfamilies (E) associated with CHARRs. (F) The relative RNA abundance (% of total) of CHARRs on constitutive heterochromatin and specific subfamilies to which they belong. Colors show the RNA classes to which individual CHARR subfamilies belong.


