
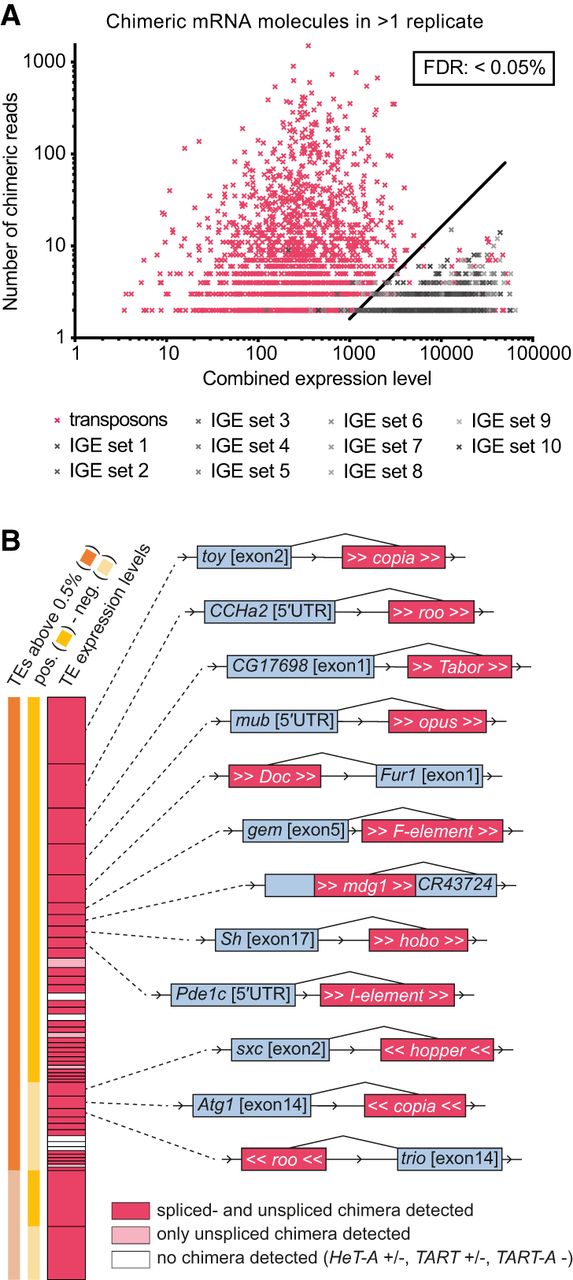
Chimeric transposon–gene mRNA is abundant in the midbrain. (A) Graph showing number of chimeric reads, combined expression levels of each transposon–gene pair (pink), and in 10 sets of IGE-gene pairs (gray). Combined expression levels are the square root of the product of reads in our bulk RNA data for both transcripts of a transposon/IGE-gene pair. IGEs were used to calculate a FDR<0.05%. (B) Examples of transposon–gene pairs for which chimeric mRNAs were detected. Pink bar represents total transposon expression in scRNA-seq data (as in Fig. 2B), grouped into sense and antisense, as well as contributing to >0.5% and <0.5% of total transposon expression. Dark pink bars indicate that both pre-mRNA and mature spliced mRNA chimeric fragments were detected. Light pink indicates only unspliced chimeras were found. Schematics show splice sites between transposon and the neighboring gene (gray and pink boxes are not to scale). For list of all chimeras, see Supplemental Table S5.


