
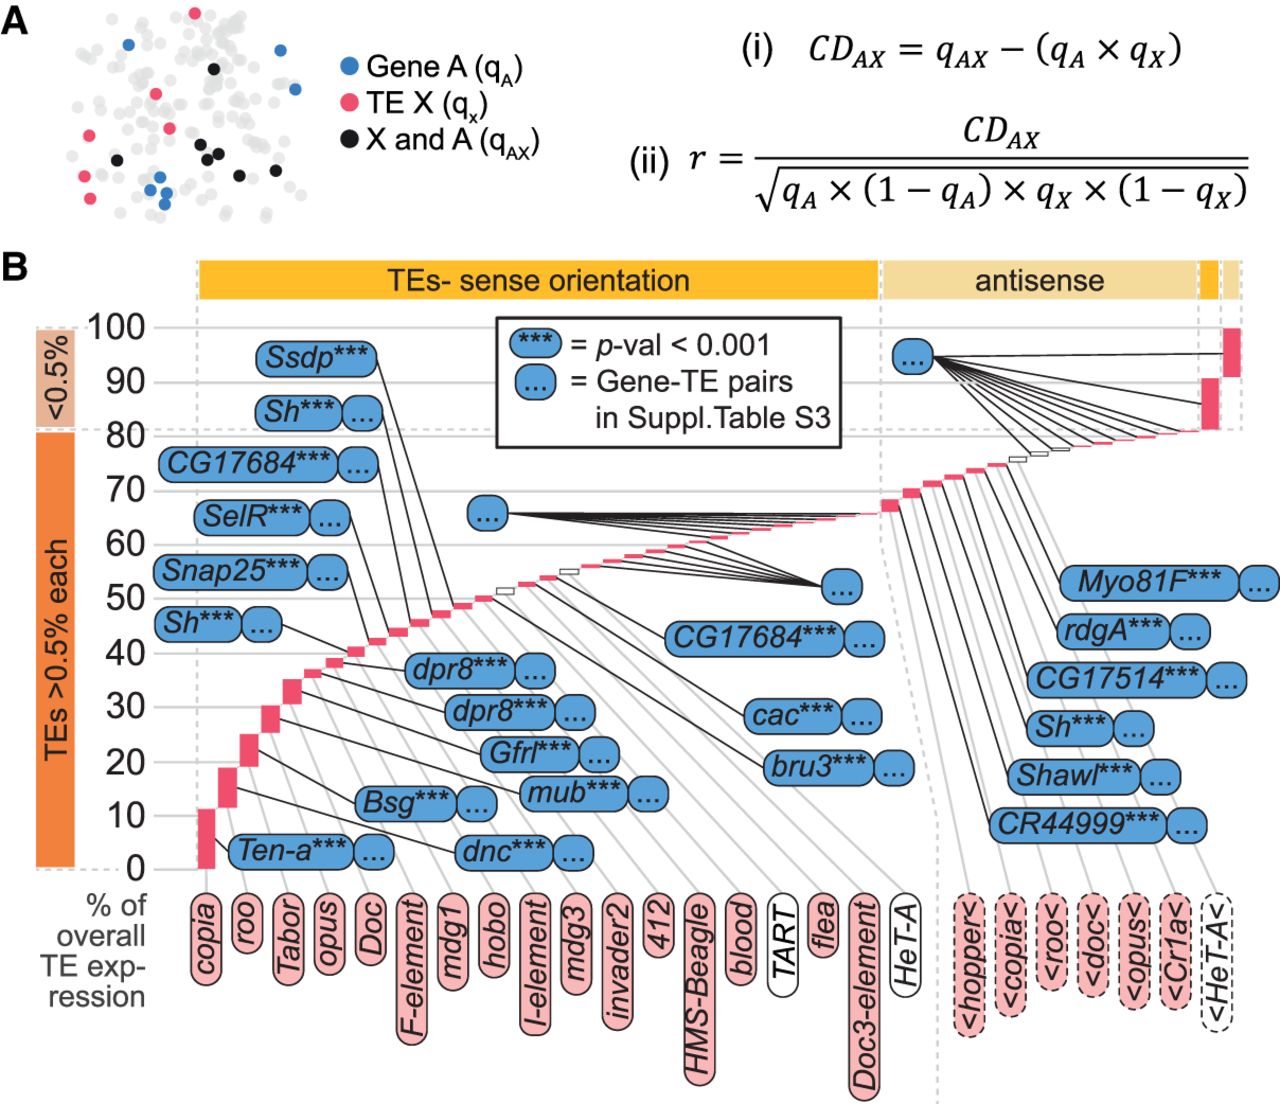
Most transposons are coexpressed with neighboring genes. (A) Schematic and formulas describing the calculation of coexpression disequilibrium (CDAX) values. (B) Examples of transposon–gene pairs that are neighboring in the genome and coexpressed across the midbrain. Height of pink bars shows relative transposon expression levels in scRNA-seq data. Transposons contributing to >0.5% of overall transposon expression, indicated by dark orange bar on the bottom left, are individually displayed, and the associated gene with the lowest corrected P-value is indicated for each one. Transposons contributing <0.5%, indicated by light orange bar on the top left, are pooled into sense and antisense expression. Transposons are also organized horizontally into sense (left side of plot marked with dark yellow bar on top) and antisense expressing elements (right side of plot, light yellow). See Supplemental Table S3 for the entire list of correlated transposon–gene pairs.


