
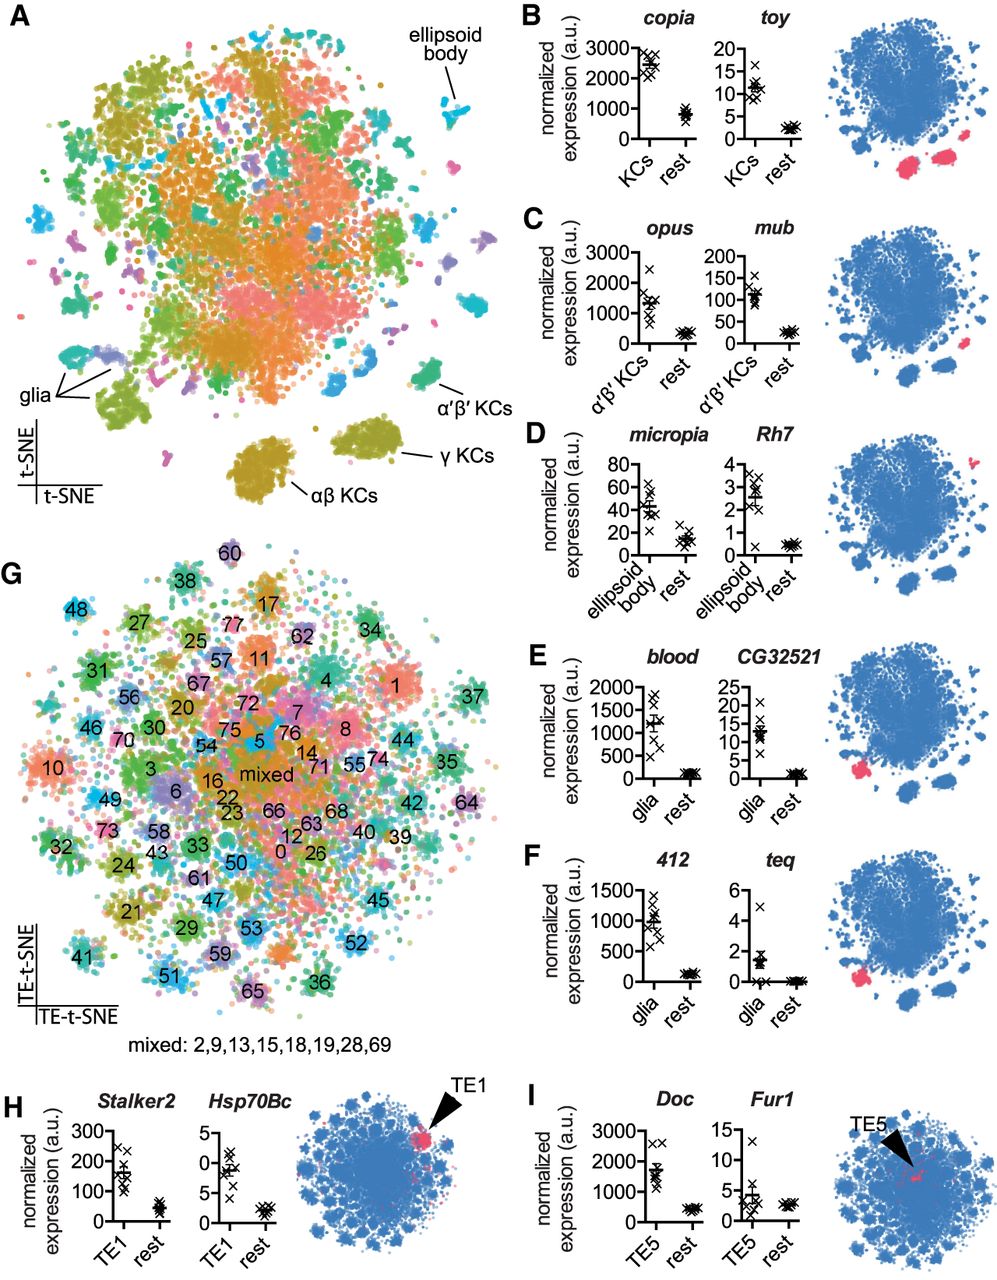
Single-cell transcriptomics reveals patterned transposon expression in the Drosophila midbrain. (A) Two-dimensional reduction (t-SNE) of 14,804 Drosophila midbrain cells based on gene expression levels. Colors represent cell clusters (at SNN resolution of 3.5). (B–F) Mean expression of transposons and neighboring cellular genes in the relevant cell groups in eight biological replicates and t-SNE representation of cell type–restricted expression. (B) copia and twin of eyeless (toy) in all Kenyon Cell (KC) classes. (C) opus and mushroom-body expressed (mub) in α′β′ KCs. (D) micropia and Rhodopsin 7 (Rh7) in the ellipsoid body. (E,F) blood and CG32521, and 412 and Tequila (teq) in glia. Values represent the mean normalized number of unique molecular identifiers (UMI's) in an average cell from each cell type and from the rest of the midbrain. Error bar indicates SEM. Transposon and gene levels were normalized separately. Blue schematic shows location of cell cluster (pink) in t-SNE plot. (G) Two-dimensional reduction of 14,804 Drosophila midbrain cells based exclusively on transposon expression levels. Colors represent cell clusters (at SNN resolution of 3.5). (H,I) Mean expression of Stalker2 and Heat-shock-protein-70Bc (Hsp70Bc), and Doc and Furin 1 (Fur1) in their relevant transposon clusters and the position of the cluster in the overall transposon-based t-SNE (indicated in pink).


