
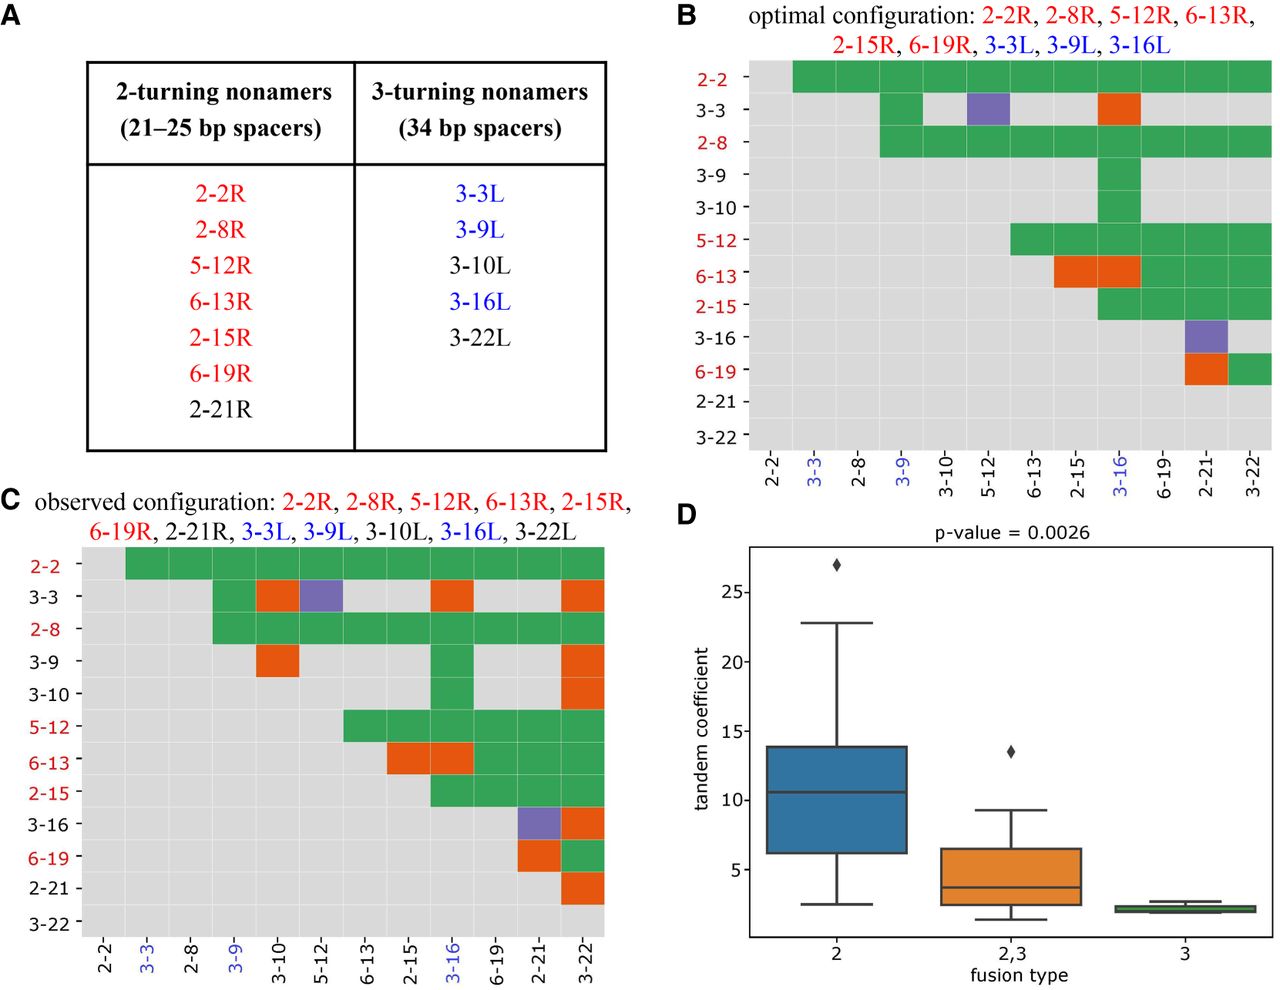
RSSs with cryptic nonamers corresponding to 2- and 3-turn spacers explain the fusion graph in Figure 2A. (A) 2- and 3-turning nonamers that “explain” the fusion graph in Figure 2A are highlighted in red and blue, respectively. (B,C) The fusion matrices with each cell classified as explained (green), unexplained (purple), or false (orange) based on the optimal configuration with nine (6 left + 3 right) cryptic nonamers (B) and the observed configuration with 12 (7 left + 5 right) cryptic nonamers (C). A D gene on the y-axis (x-axis) is colored red (blue) if its right (left) RSS contributes to the optimal configuration. (D) Each tandem fusion in Figure 2 is classified by the number of turns in cryptic nonamers that can explain it. For example, the fusion (D2-2, D3-3) can be explained by both 2–turning and 3–turning nonamers and thus is classified as “2,3 fusion type.” In total, we generate three groups: “2” (fusions are explained by the 2–turning nonamers), “2,3” (fusions are explained either by the 2-turning or by the 3–turning nonamers), and “3” (fusions are explained by the 3-turning nonamers) with average values of tandem coefficients 10.7, 5.0, and 2.2, respectively. The y-axis shows tandem coefficients of tandem fusions. Group “2” has higher values of tandem coefficients that groups “2,3” and “3” (P-value = 0.0026 according to the one-way ANOVA test [Heiman 2001]).


