
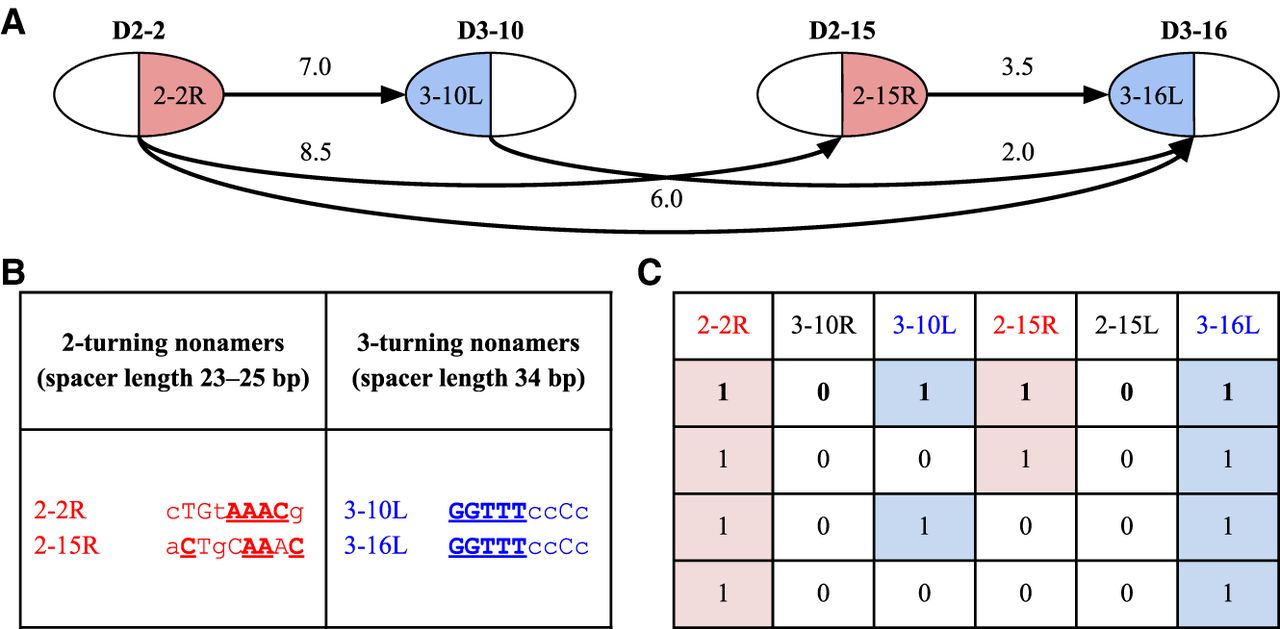
Fusion graph on genes D2–2, D3–10, D2–15, and D3–16 (A), cryptic nonamers in RSSs of these genes that explain this graph (B), and four optimal configurations for this graph (C). (A) Fusion graph on genes D2–2, D3–10, D2–15, and D3–16. Each cryptic nonamer is shown as either a blue left half-vertex or a red right half-vertex of the corresponding vertex in the fusion graph. Edges represent tandem fusions and are labeled with the tandem coefficient for the corresponding fusion. The edge between D3–10 and D2–15 is not shown since these genes do not form tandem fusions. (B) The table shows that all cryptic nonamers in RSSs of genes D2-2, D3-10, D2-15, and D3–16, found among the top 12 nonamers, correspond to 2- and 3-turning nonamers; 2- and 3-turning cryptic nonamers explain all edges of the fusion graph and do not “trigger” any other edges. Conserved positions in these nonamers are shown by uppercase letters. Positions coinciding with the consensus sequence of the canonical nonamers are bolded and underlined. (C) The table shows four optimal configurations of cryptic RSSs (i.e., configurations explaining all edges of the fusion graph) for the fusion graph on genes D2-2, D3-10, D2-15, and D3-16. Each configuration is shown as a binary vector, where 1 (0) means that the corresponding cryptic nonamer forms (does not form) tandem fusions.


