
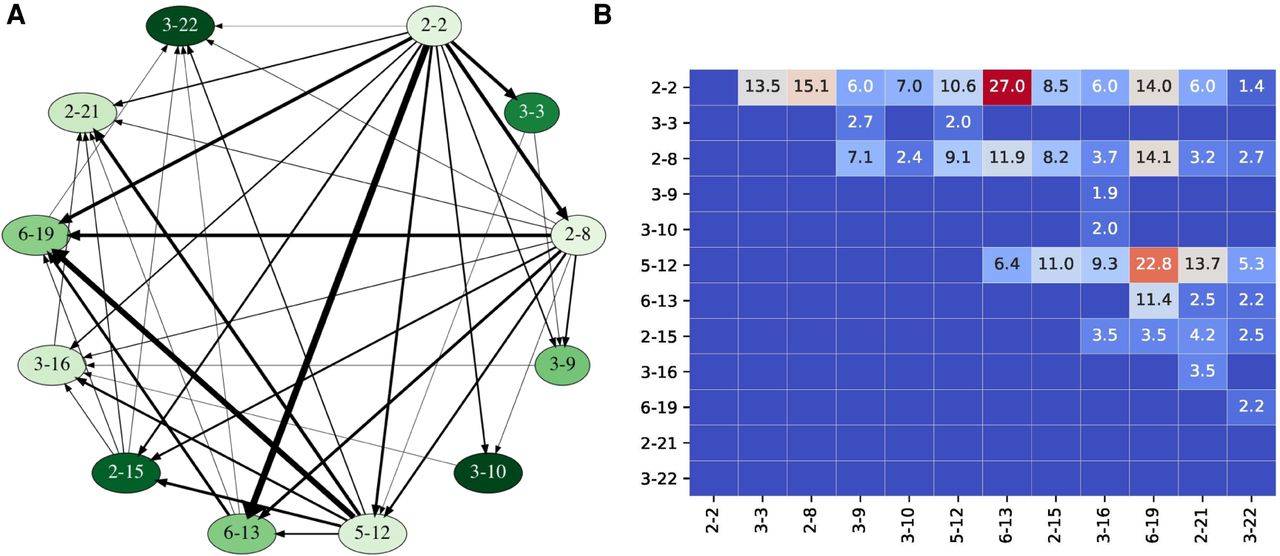
Fusion graph and fusion matrix for 12 D genes with at least 2% usage computed for the ALLERGY data set. (A) Vertices of the fusion graph are arranged clockwise along the circle according to the order in the IGHD locus, from D2-2 to D3-22. Vertices are colored according to the usage of the corresponding D genes: from pale (D2-8, usage 2.0%) to dark (D3-10, usage 15.5%). Each directed edge connects a vertex D with a vertex D*, where D* follows D in the IGHD locus. The width of an edge (D, D*) is proportional to coeff(D, D*). Only edges corresponding to coupled D genes are shown. (B) The matrix on the right shows values of coeff(D, D*) for fusions of the selected twelve commonly used IGHD genes, where genes D and D* correspond to rows and columns, respectively. Cells are colored according to the values of tandem coefficients: from low (dark blue) through medium (pale) to high (dark red).


