
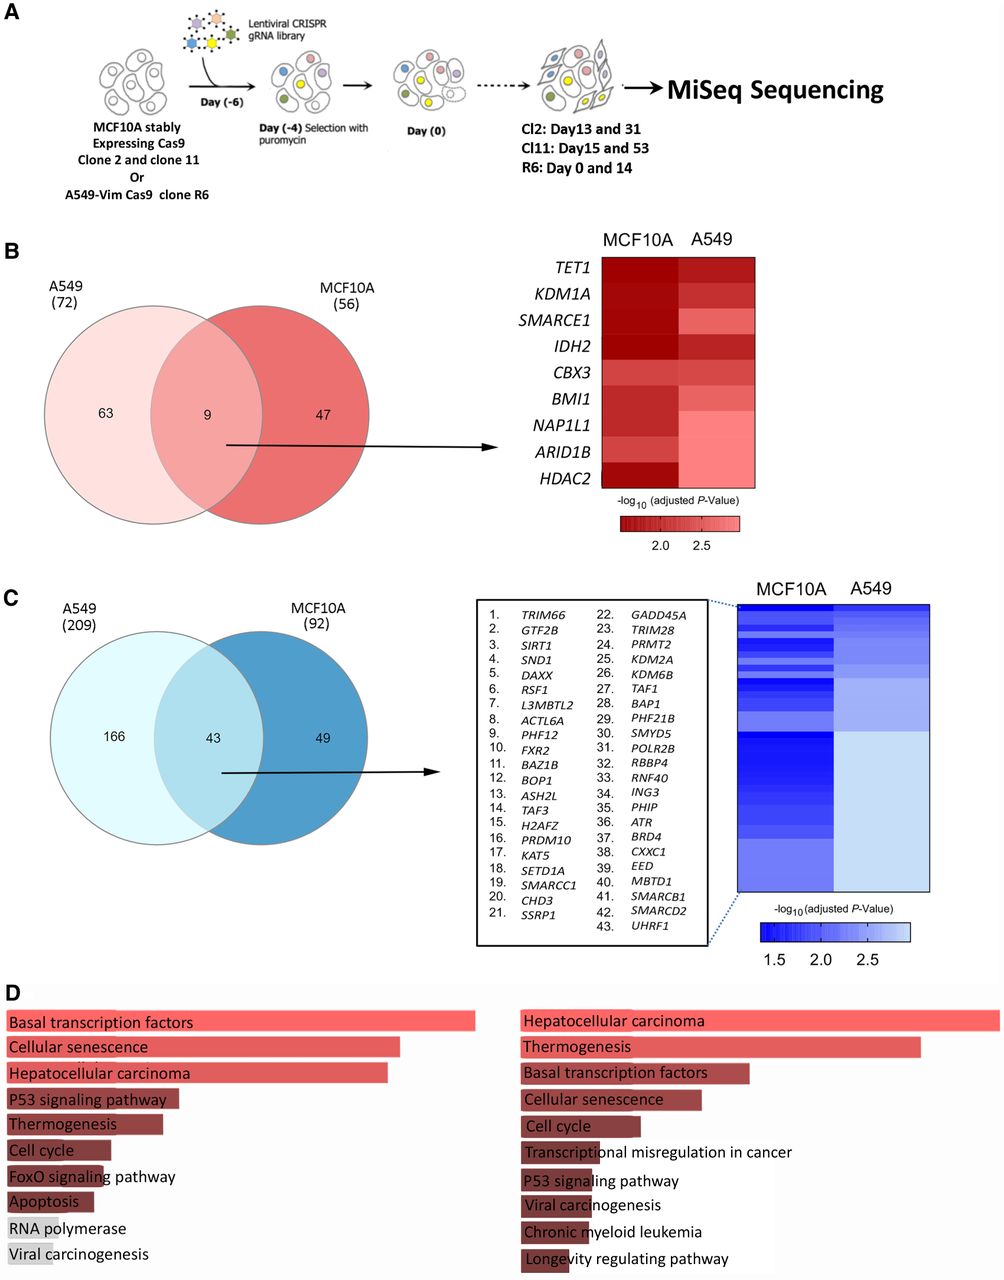
CRISPR-Cas9 screen to perform orthogonal assessment of the driver potential of ERGs in cancer cell proliferation. (A) The screening strategy used to identify regulators of cell proliferation among ERGs in both A549 and MCF10A cell lines/clones. (B,C, left) Venn diagrams showing the genes associated with significantly enriched (B) or depleted (C) gRNAs in the screens performed on A549 and MCF10A cells using edgeR analysis in CRISPRAnalyzeR. (B,C, right) Heatmaps showing the adjusted P-values of the commonly enriched (B) or depleted (C) gRNAs in both cell lines. Data are presented as –log10 (adjusted P-value). (D) KEGG pathway analysis performed on genes associated with commonly depleted gRNAs (left) and with commonly depleted and enriched gRNAs (right) in both cell lines. All pathways in red show P < 0.05.


