
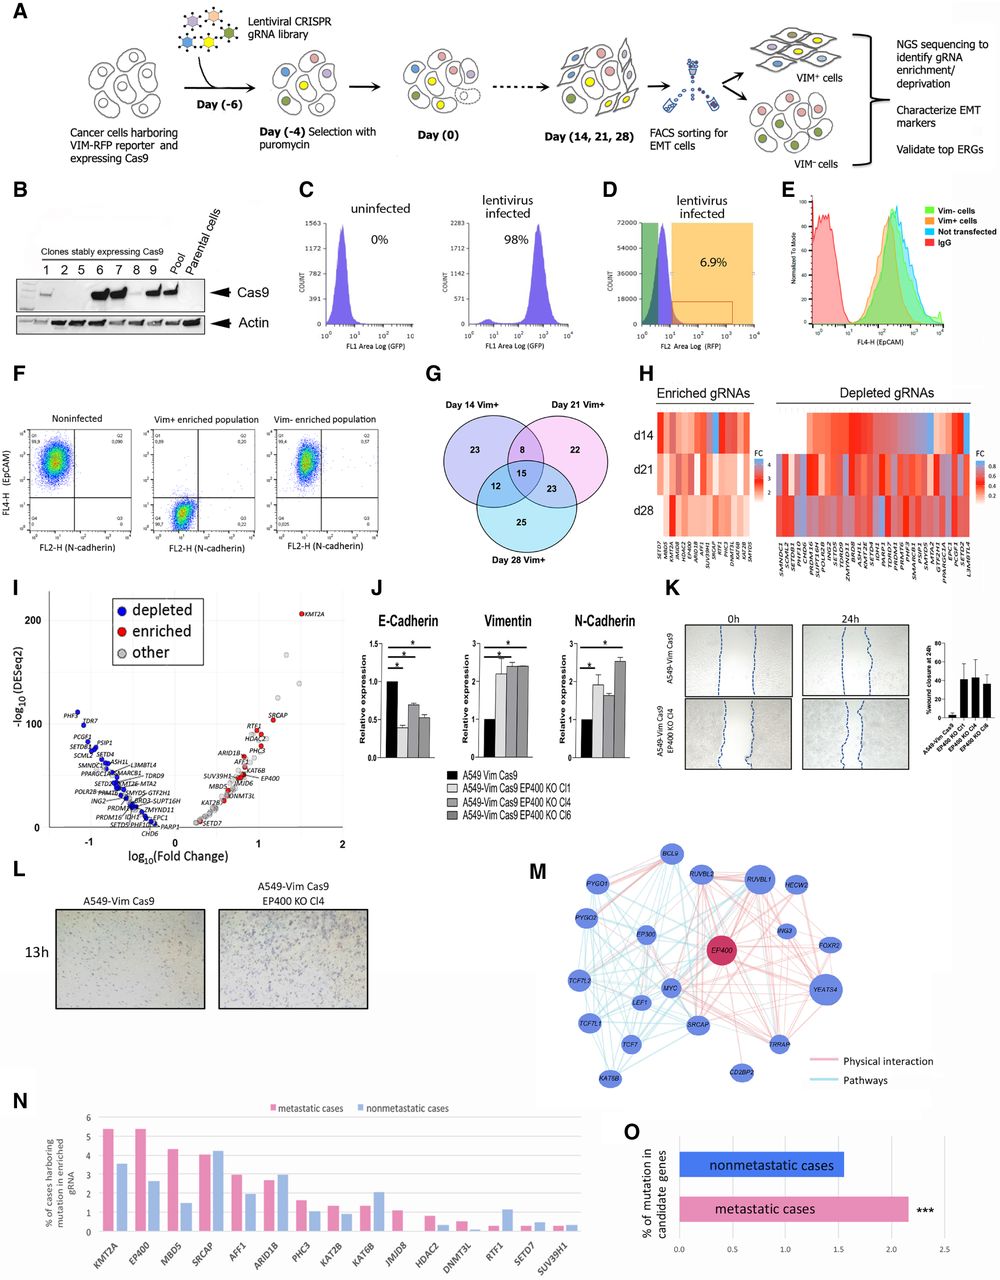
CRISPR-Cas9 screen to perform orthogonal assessment of the driver potential of ERGs in EMT. (A) The screening strategy used to identify positive and negative regulators of EMT among ERGs. (B) Western blot analysis of Cas9 expression in A549 lung cancer cells. “Pool” represents a heterogeneous population of transduced and stably Cas9 expressing cells derived from the parental cells. Individual cell clones derived by cloning rings are numbered 1, 2, 5, 6, 7, 8, and 9. Actin beta was used to normalize for equal loading. (C) Validation of the transduction efficiency of the lentiviral CRISPR ERG library 10 d after puromycin selection using FACS compared with uninfected A549 cells. (D) Enrichment of vimentin-positive (VIM+) population analyzed by FACS after CRISPR ERG library transduction at day 14 after puromycin selection. (E) Validation of cell sorting for the enrichment of VIM+ population by FACS based on the fluorescent antibody EPCAM (EPCAM loss is associated with the mesenchymal cell state) of VIM+, vimentin-negative (VIM−), uninfected cell line, and negative control antibody IgG. (F) Confirmation of cell enrichment for VIM+ and VIM− fractions after sorting. FACS-sorted VIM+ and VIM− populations were grown in culture for 2 wk and analyzed by FACS after staining with cadherin 2 (also known as N-cadherin) antibodies. (G) The overlap of the top EMT-associated ERG gRNAs after Illumina MiSeq deep sequencing; the numbers are derived from two statistical methods (DESeq2 and edgeR) at days 14, 21, and 28 after transduction. (H) Heatmap showing the top ERGs based on enriched and depleted gRNAs at days 14, 21, and 28 after transduction compared with day 0. (I) Volcano plot of ERG gRNAs at day 28 after transduction. (J) Expression analysis by qRT-PCR of EMT markers (cadherin 1 [also known as E-cadherin], vimentin, and cadherin 2) on single targeted A549-VimCas9 clones following EP400 loss of function, relative to expression in the parental A549 Vim Cas9 cell line. (*) P < 0.05, indicates results of one-way ANOVA test. Error bars are SEM of n = 2. (K) Representative image of scratch assay performed on the parental cell line and three generated EP400 KO clones at day 0 and after 24 h (left). On the right, a graph plot showing percentage area closure 24 h after the scratch as averaged of at least six areas analyzed for each clone and for the parental cell line. Experiments were performed in duplicates. (L) Transwell migration assay showing increase of migration at 13 h for A549-Vim Cas9 EP400 KO Cl4 compared to the parental cell line. (KO) Knockout; (Cl) clone; (vim) vimentin. (M) An example of network analysis of selected top ERGs (EP400) associated with the EMT population, obtained with the GeneMANIA package. (N,O) The bar plots show the mutation frequency of EMT-specific ERGs (identified in the CRISPR-Cas9 screen) in clinical samples from nonmetastatic (M0) and metastatic (M1) subsets (based on the annotation of TCGA samples).


