
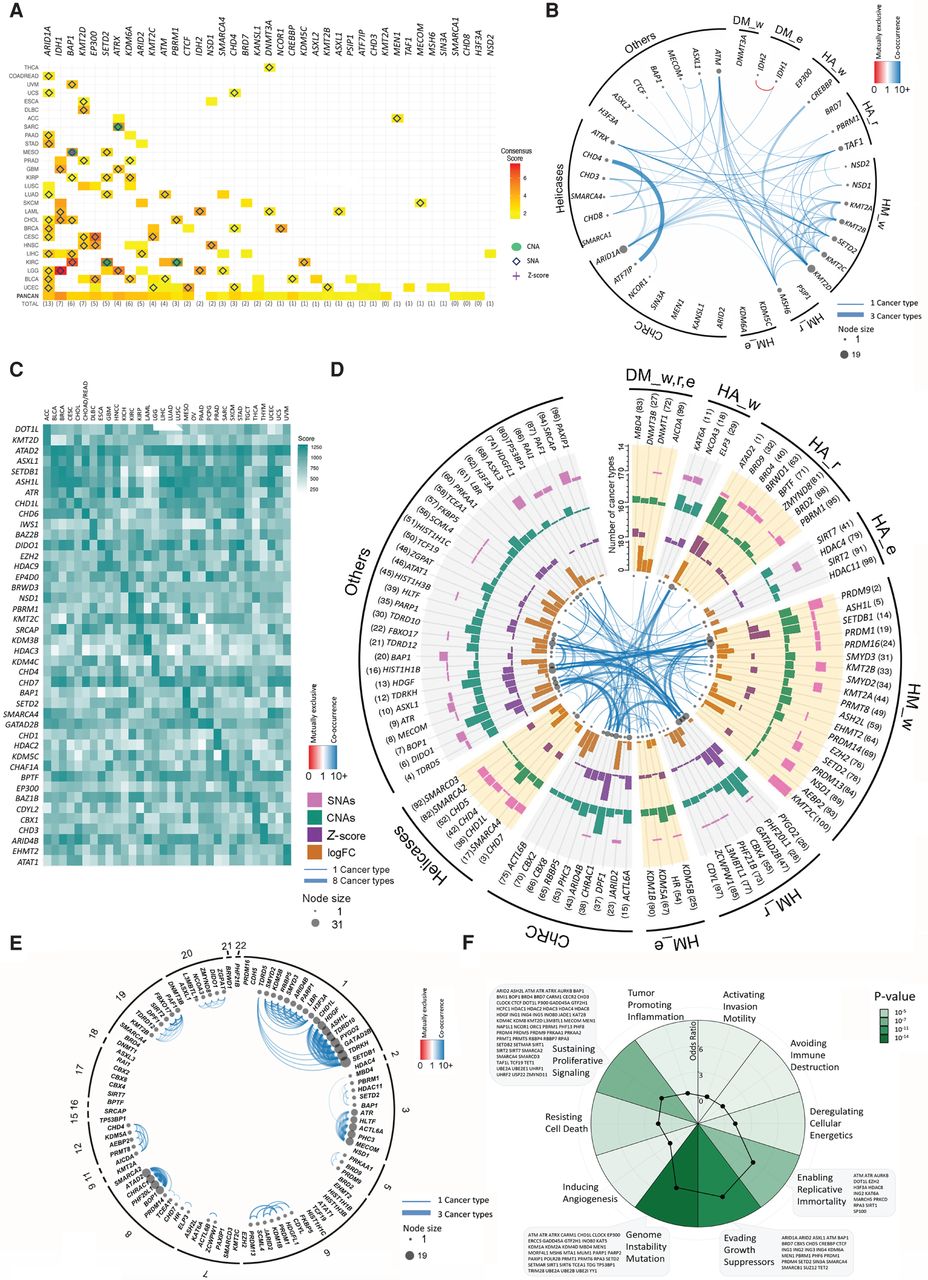
Characterization of ERG driver potentials. (A) Heatmap showing the ConsensusDriver scores (with values ranging from 1.5 to 7.5) as obtained by Bailey et al. (2018). ERGs with a score ≥ 1.5 in at least one cancer type are shown. The top 10 deep amplifications or deletions (green circles), SNAs (blue empty diamonds), or significant Z-score (purple crosses) of each cancer are overlapped onto the heatmap. (B) Significant (FDR < 0.05) co-occurrence and mutual exclusivity for ConsensusDriver ERGs in a pan-cancer analysis. The node size is proportional to both the number and thickness of its connections with other nodes. Blue and red edges represent co-occurrence (odds ratio [OR] > 1) and mutual exclusivity (OR < 1), respectively. The transparency of the edges indicates the average OR across cancer types, and their thickness is proportional to the number of cancer types in which the OR is significant. The co-occurrence filter was set to at least 5% of the samples per cancer type (Methods). (C) Heatmap of the Multi-Omics Driver scores of ERGs per cancer type. The ERGs shown represent a pooled set of the top three ERGs in each cancer type, as ranked by the mutli-omics driver score. (D) Top 100 ERGs by Pan-Cancer Driver score using SNA (5% of samples), CNA (5% of samples), and expression data (15% of samples with significant Z-score or FDR < 0,05 with log10FC > 1). Results are represented as bar plots counting the number of cancers in which a given gene has a particular genomic or expression alteration. From outer to inner track: (1, pink) SNAs; (2, green) CNAs; (3, purple) Z-score; (4, orange) log10FC. Inside the last track, co-occurrence or mutual exclusivity was calculated as in B, except that the co-occurrence filter was set to at least 10% of the samples per cancer type. Genes are aggregated by their functional features. (E) Significant co-occurrence for the top 100 ERGs by Pan-Cancer Driver score. Co-occurrence or mutual exclusivity was calculated as in D but ordered instead by chromosome number. (F) Spider pie chart showing enrichment of the 426 ERGs in pathways affecting the 10 hallmarks of cancer; the corresponding P-values and ORs are illustrated by green gradients and black spots, respectively. The names of ERGs overlapping with the four significantly enriched hallmarks are indicated.


