
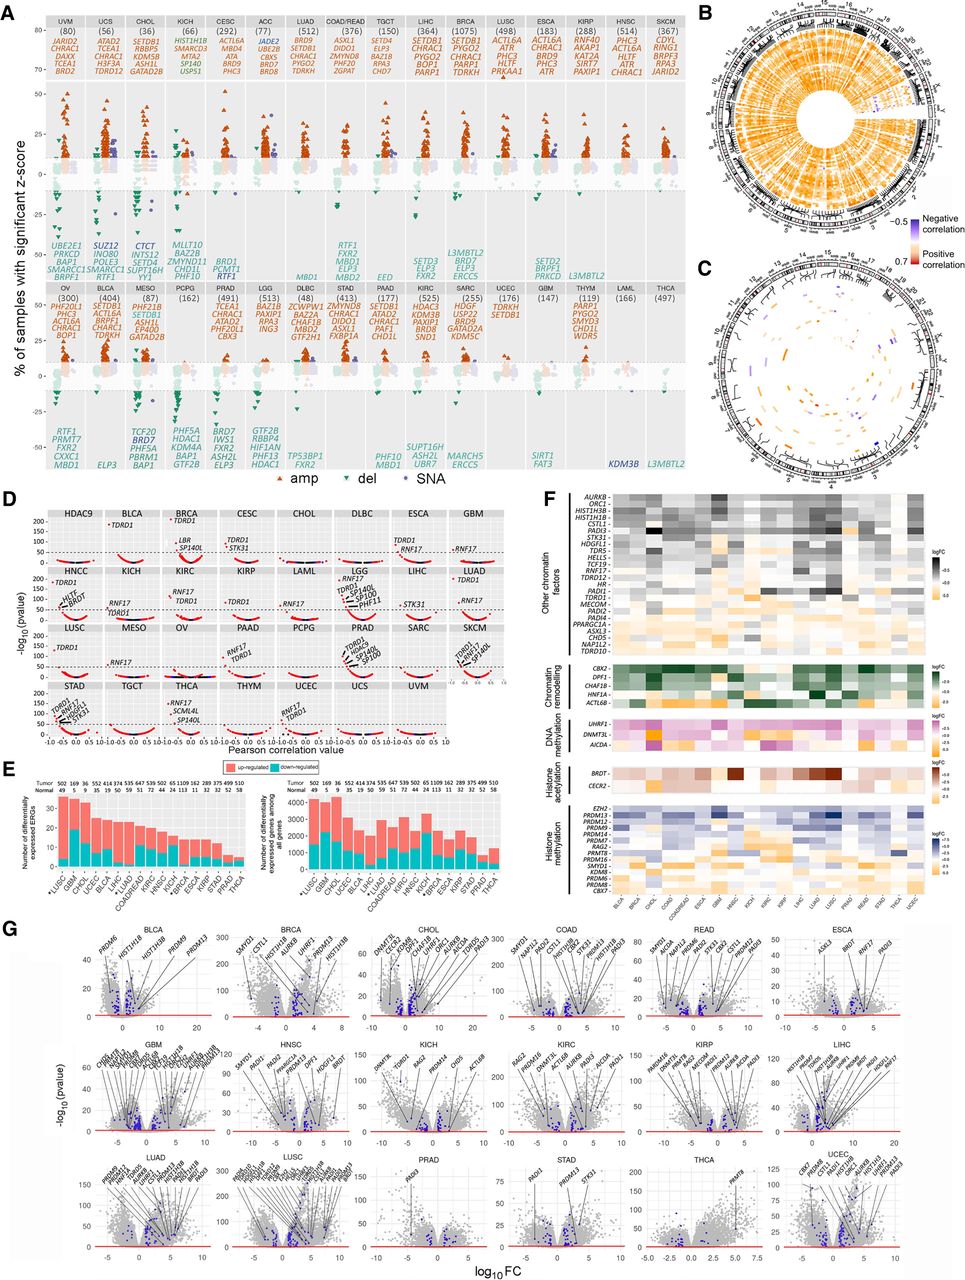
RNA expression alterations of ERGs across cancer types, in relation to genetic and DNA methylome variations. (A) Multi-omics plot of SNA, CNA, and RNA expression alterations across ERGs and cancer types. Amplifications, deletions, and SNAs were annotated as described in Methods. The most deregulated ERGs in RNA expression (with the y-axis value above 10) are highlighted for each cancer type. (B,C) Circos plots showing Pearson's correlation between CNAs (B) or SNAs (C) and expression Z-scores in different cancer types across the chromosomal regions. Positive and negative correlations are indicated in orange and blue, respectively. Only ERGs with correlation (R2) > 30% and FDR < 0.05 in at least in one cancer type were considered for the analysis in B; the R2 limit was set to 10% in C. (D) Expression quantitative trait methylation (eQTMs) analysis showing Pearson correlation values (x-axis) between RNA (RSEM counts) and methylation (beta) levels of promoter CpGs for each ERG in different cancer types. The line bar indicates highly significant CpGs [−log(P-value) > 50]. Red, blue, and black dots represent CpGs with FDR < 0.05, P < 0.05, and P > 0.05, respectively. (E) Number of ERGs or all genes with differential RNA expression in tumor relative to adjacent normal tissues for each cancer type (|log FC| > 2 and FDR < 0.05). The star denotes a P-value < 0.05 by a two-sample test of proportions of up- versus down-regulation. (F) Heatmaps showing the most differentially expressed ERGs comparing tumor samples with adjacent normal tissues among cancer types. Only the top differently expressed ERGs with |log FC| > 3 and FDR < 0.05 are annotated. (G) Volcano plots showing differentially expressed ERGs in tumors relative to adjacent normal tissues. ERGs are shown in blue (|log FC| > 1), and the most deregulated ERGs with |log FC| > 3 are highlighted for each cancer type (FDR < 0.05). Sample sizes for each cancer type are indicated in A and E.


